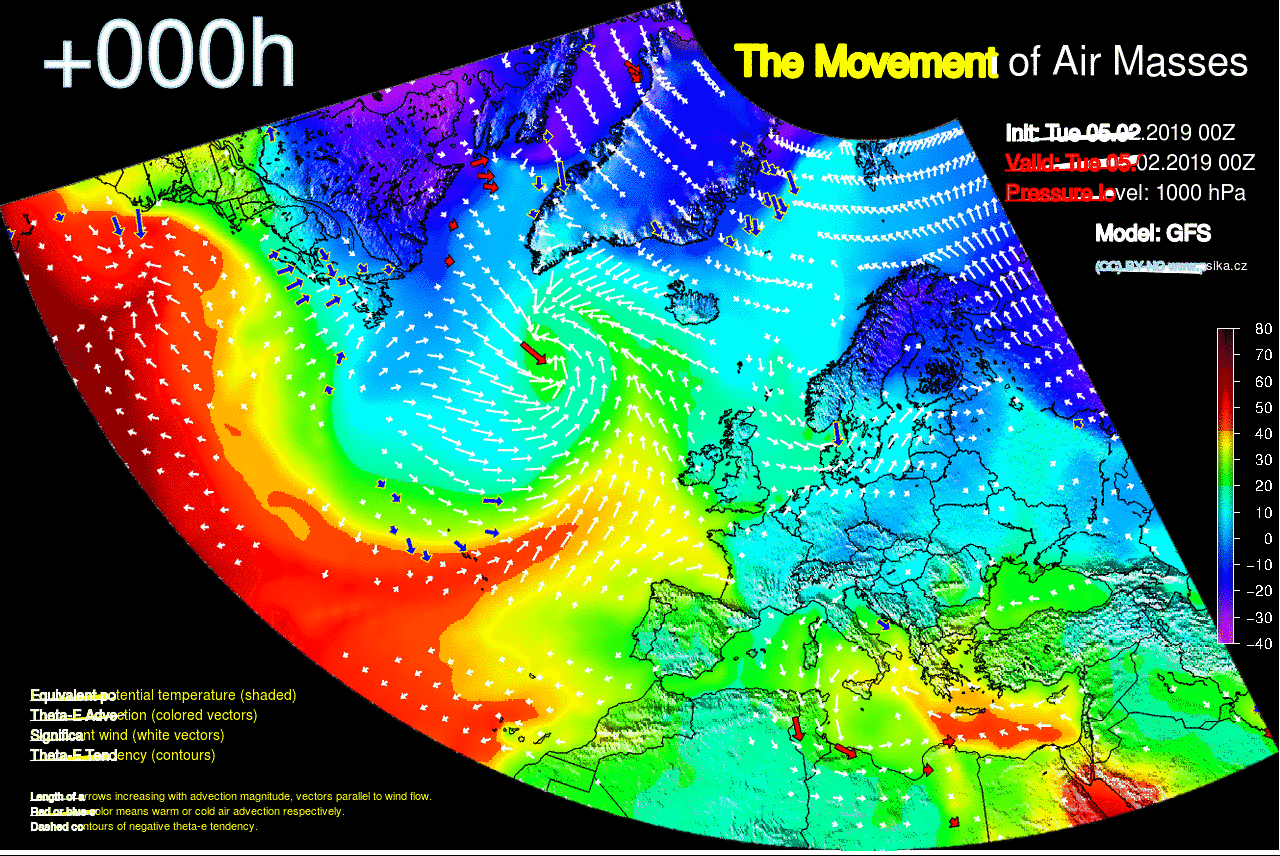
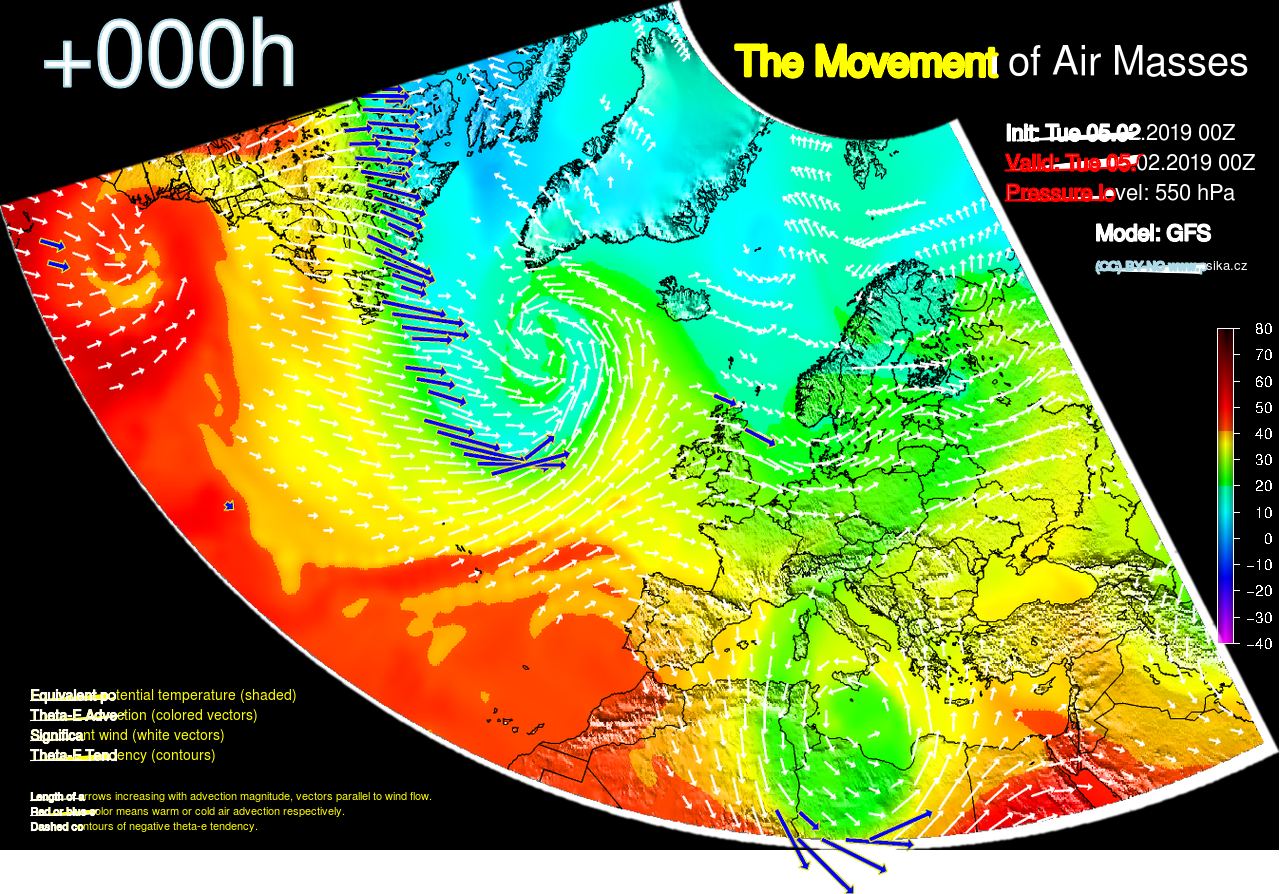
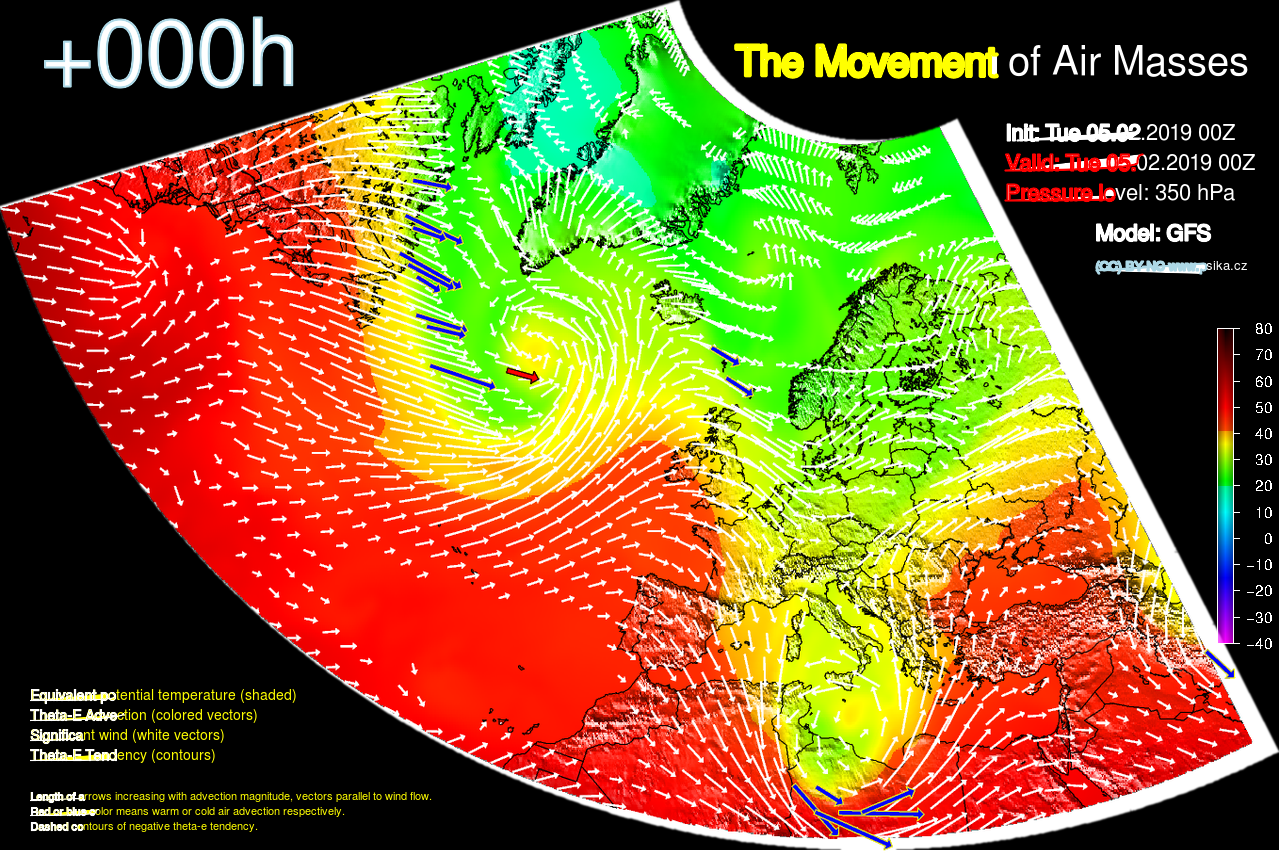
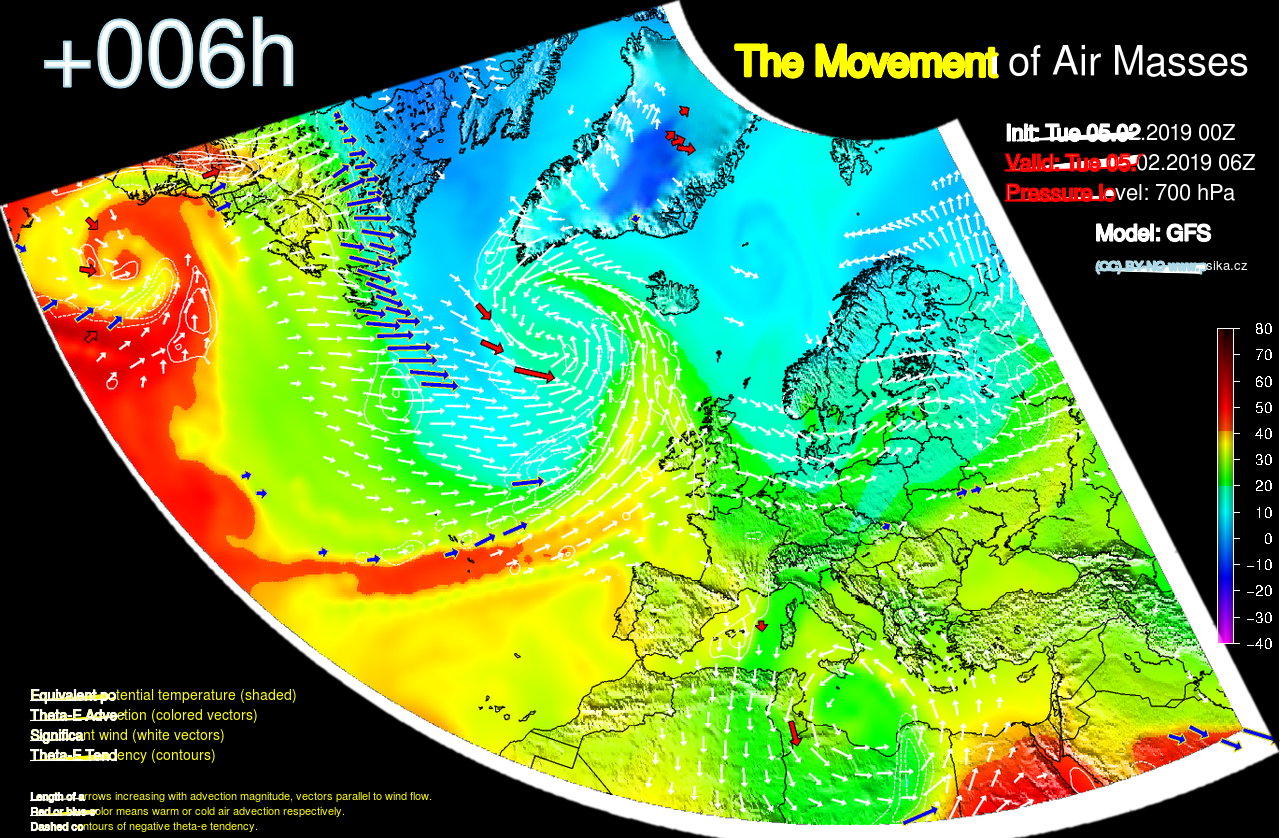
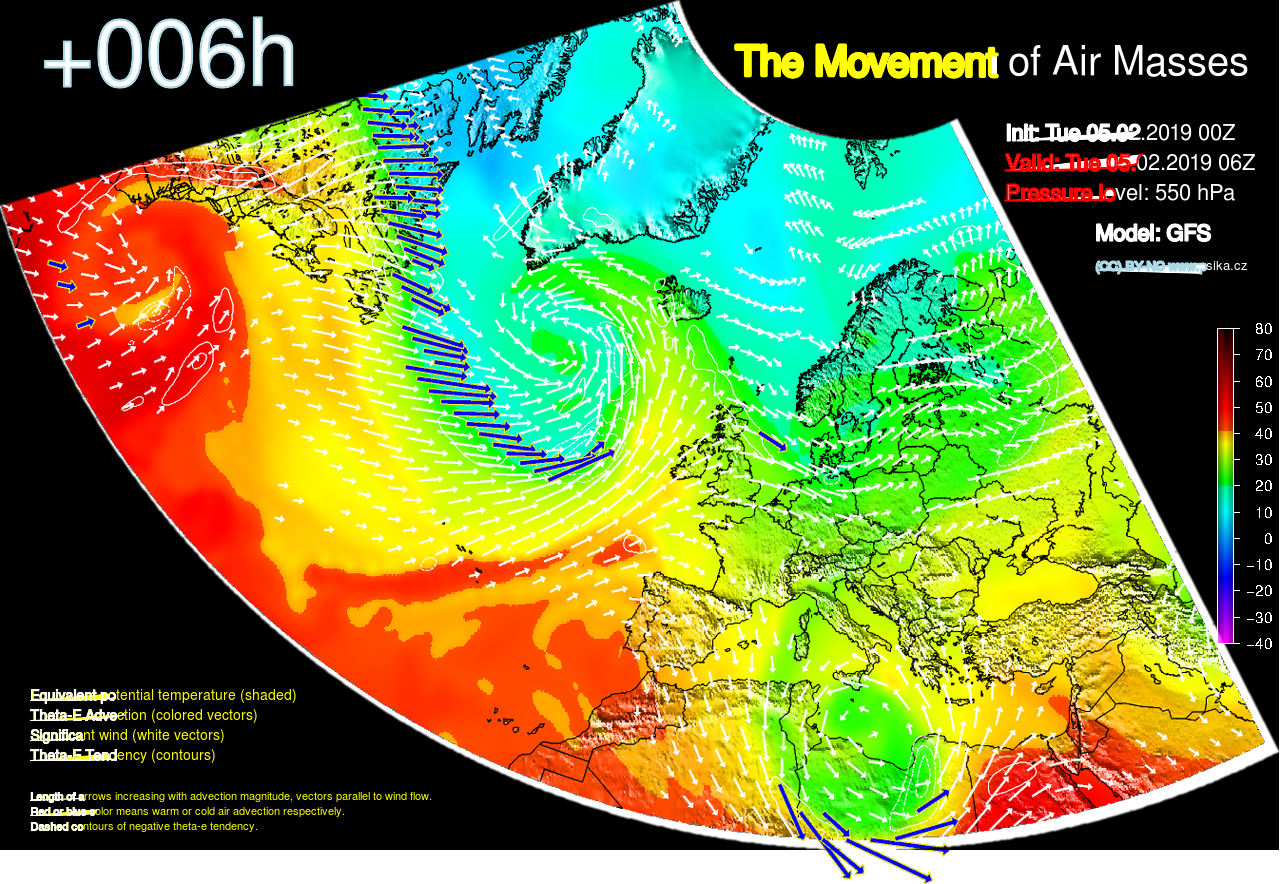
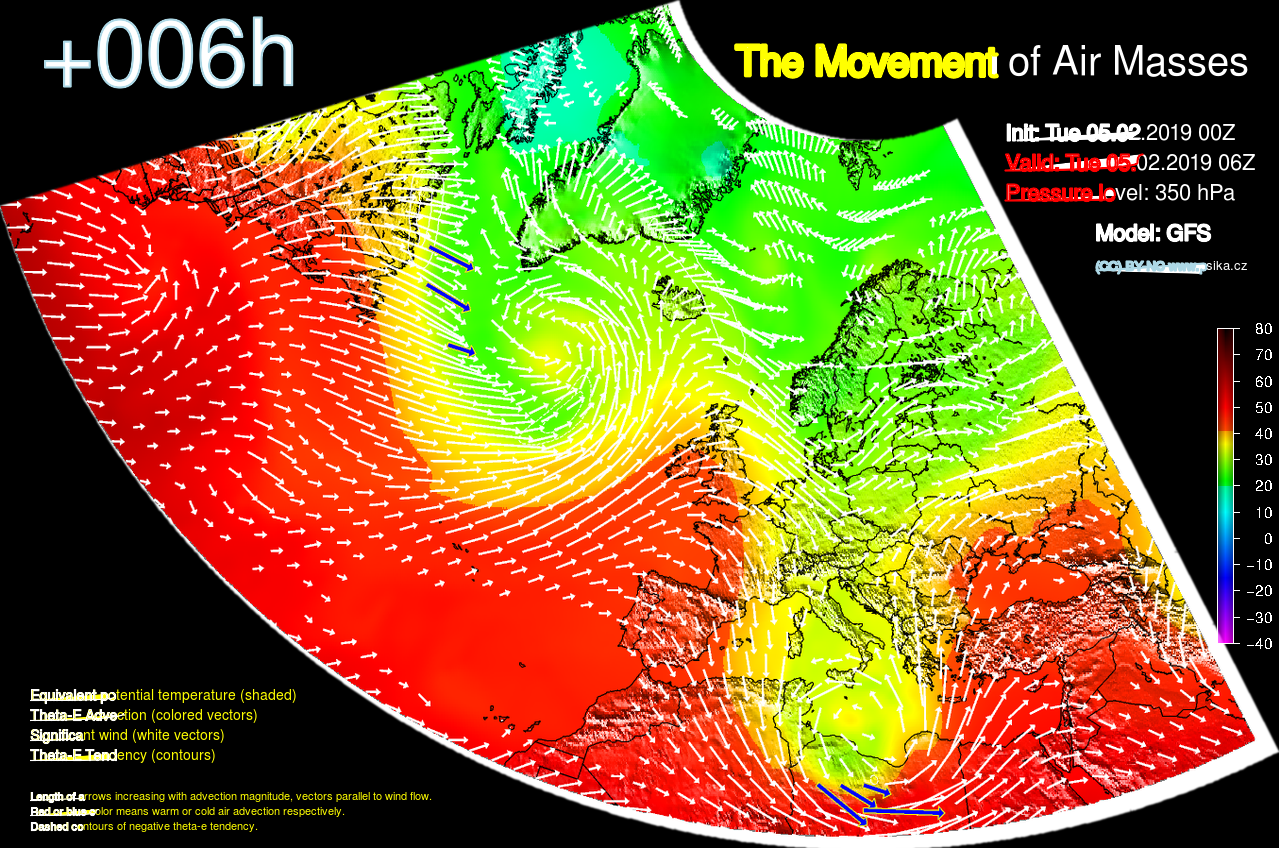
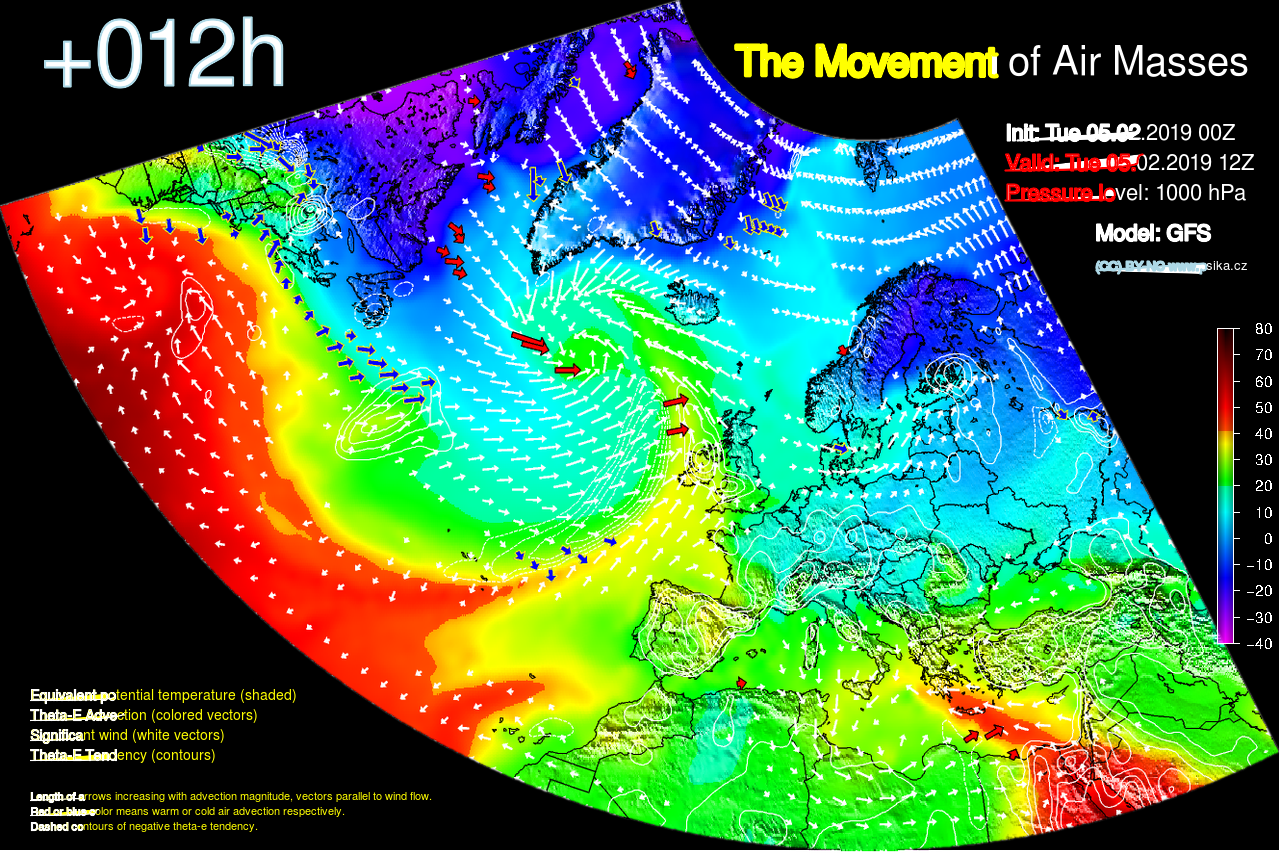
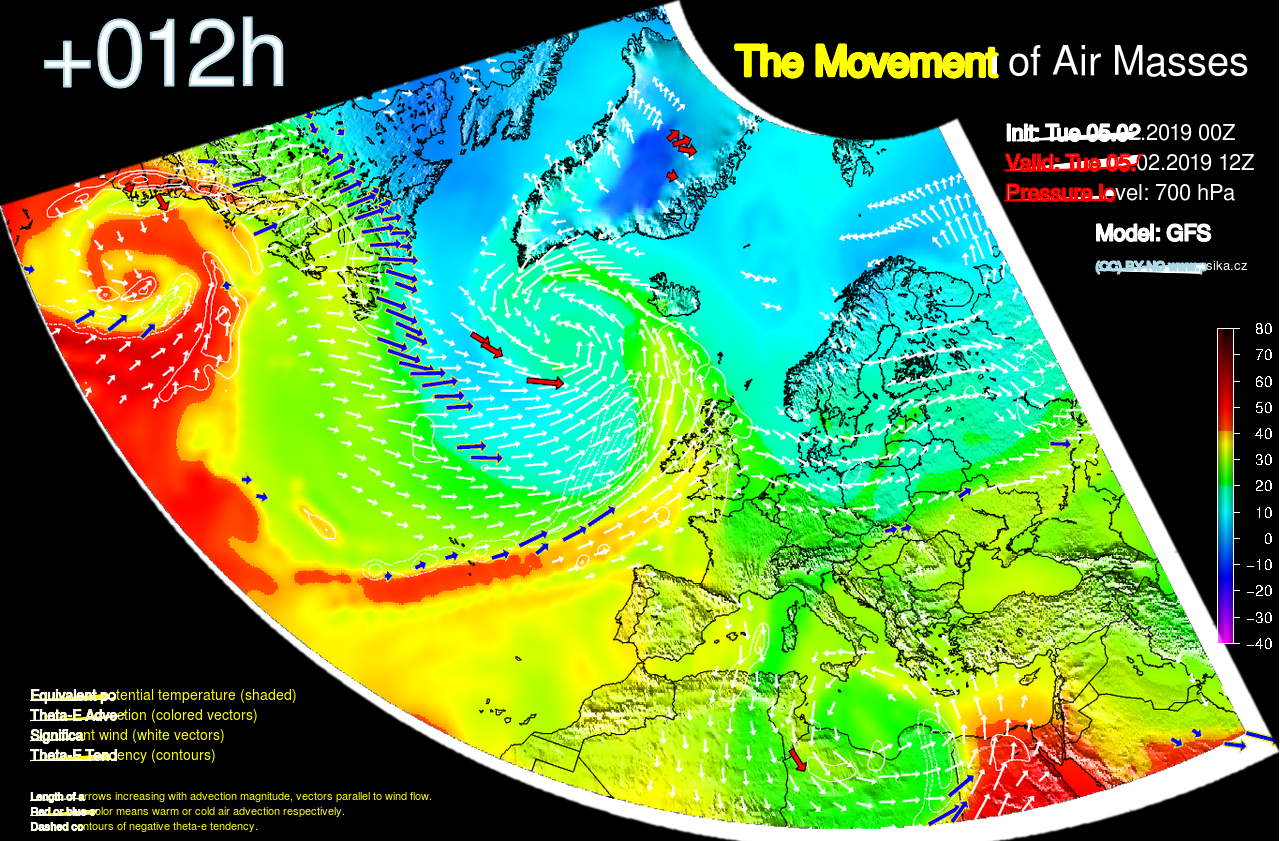
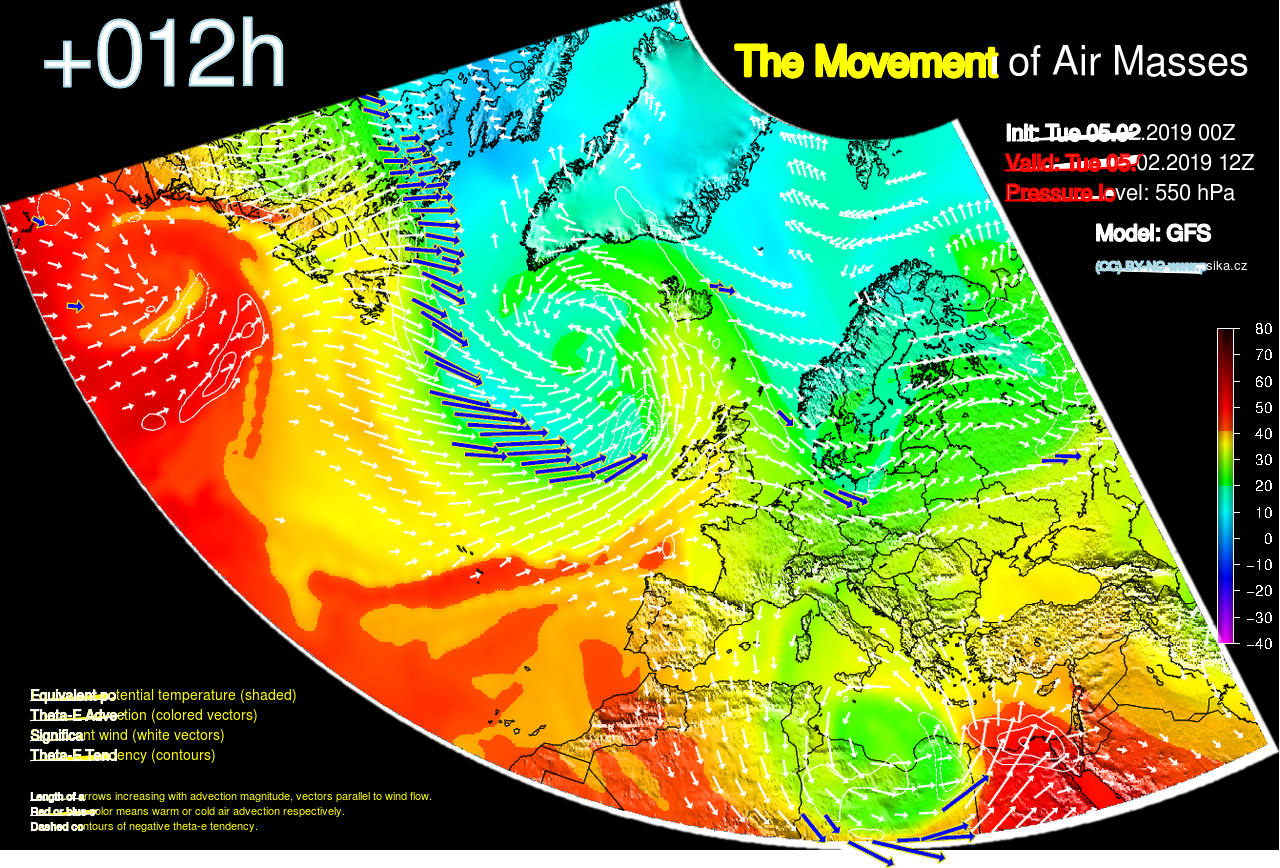
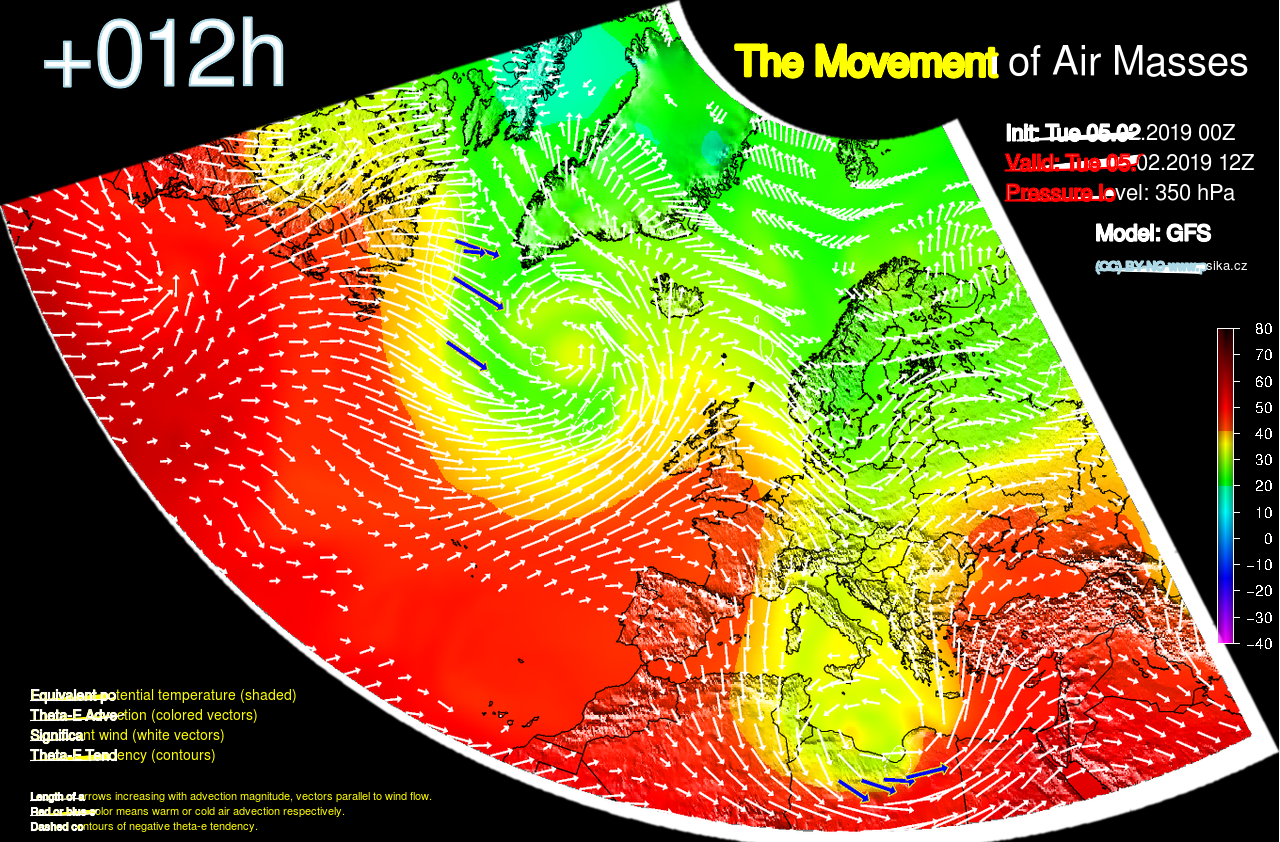
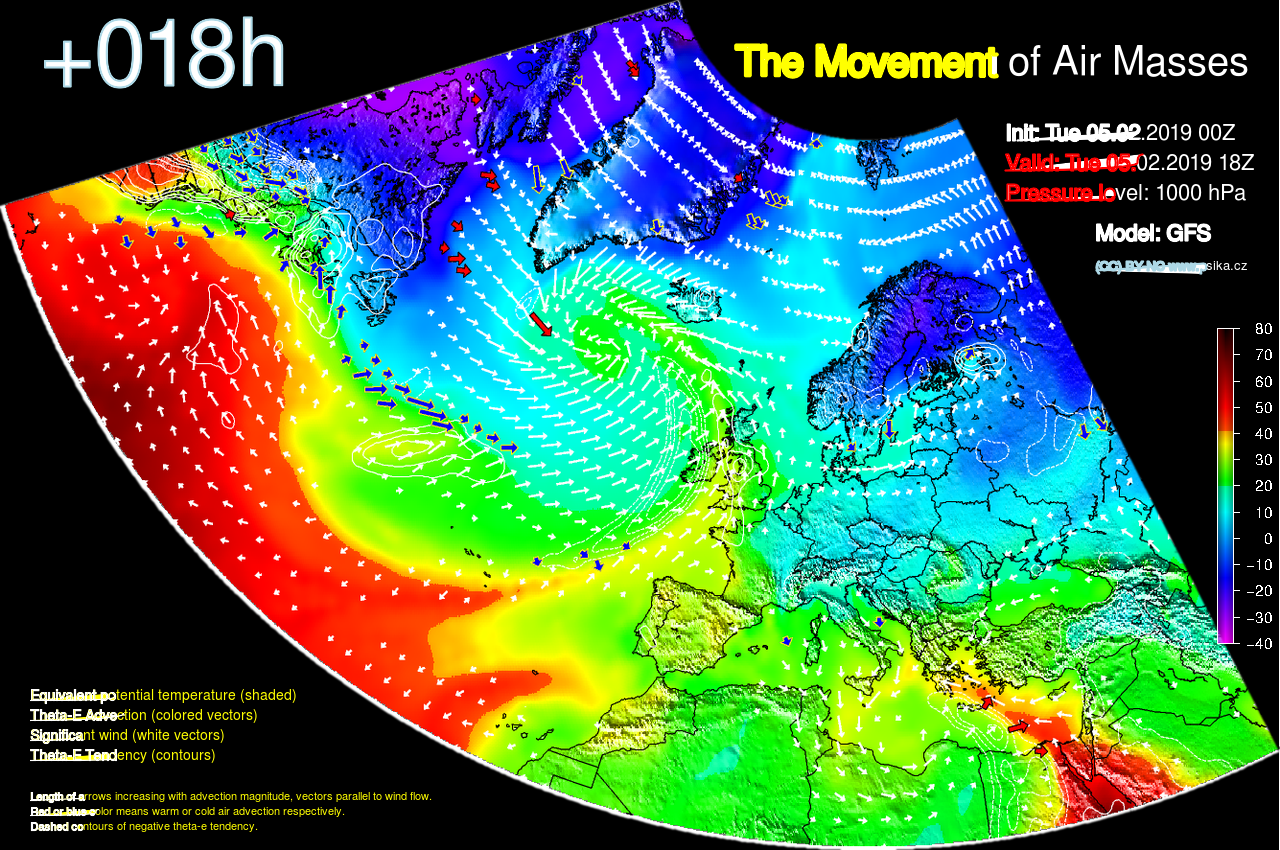
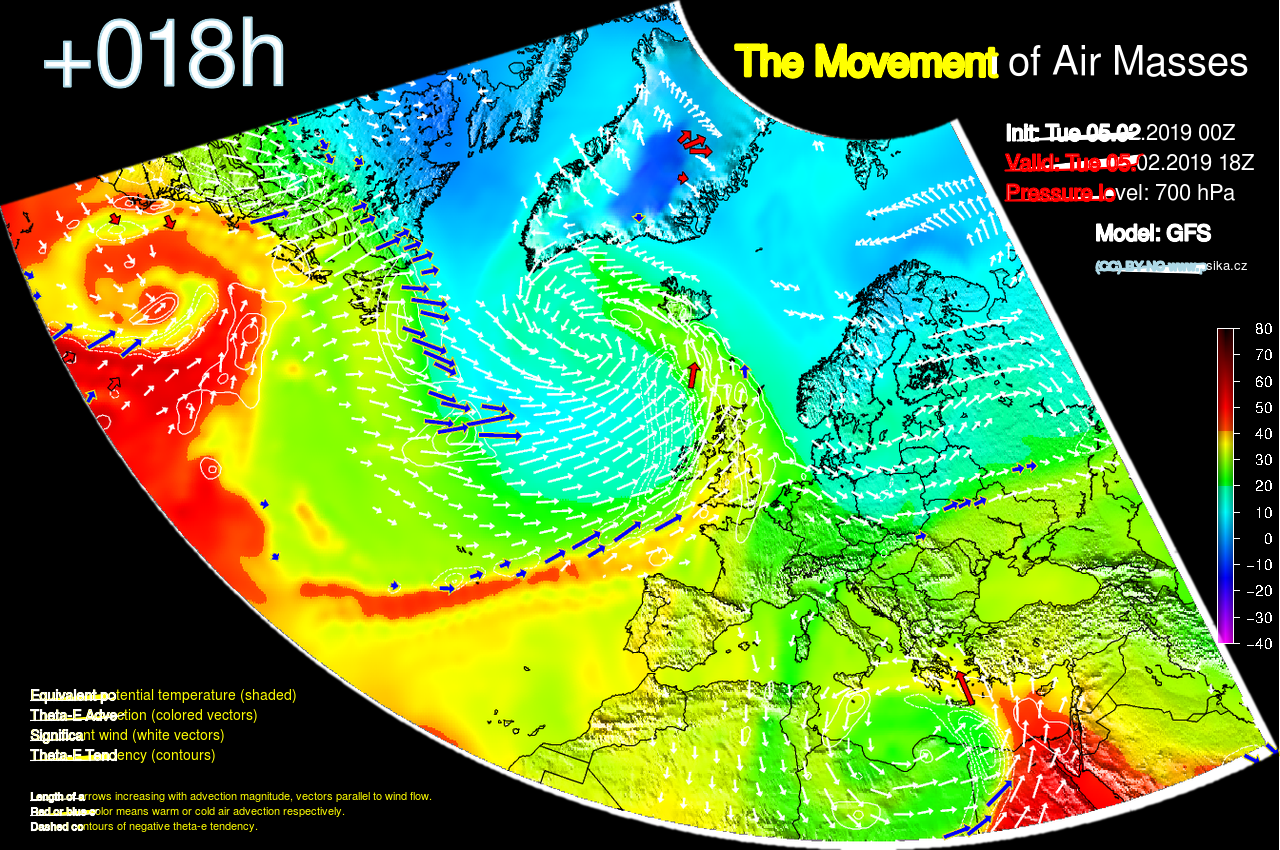
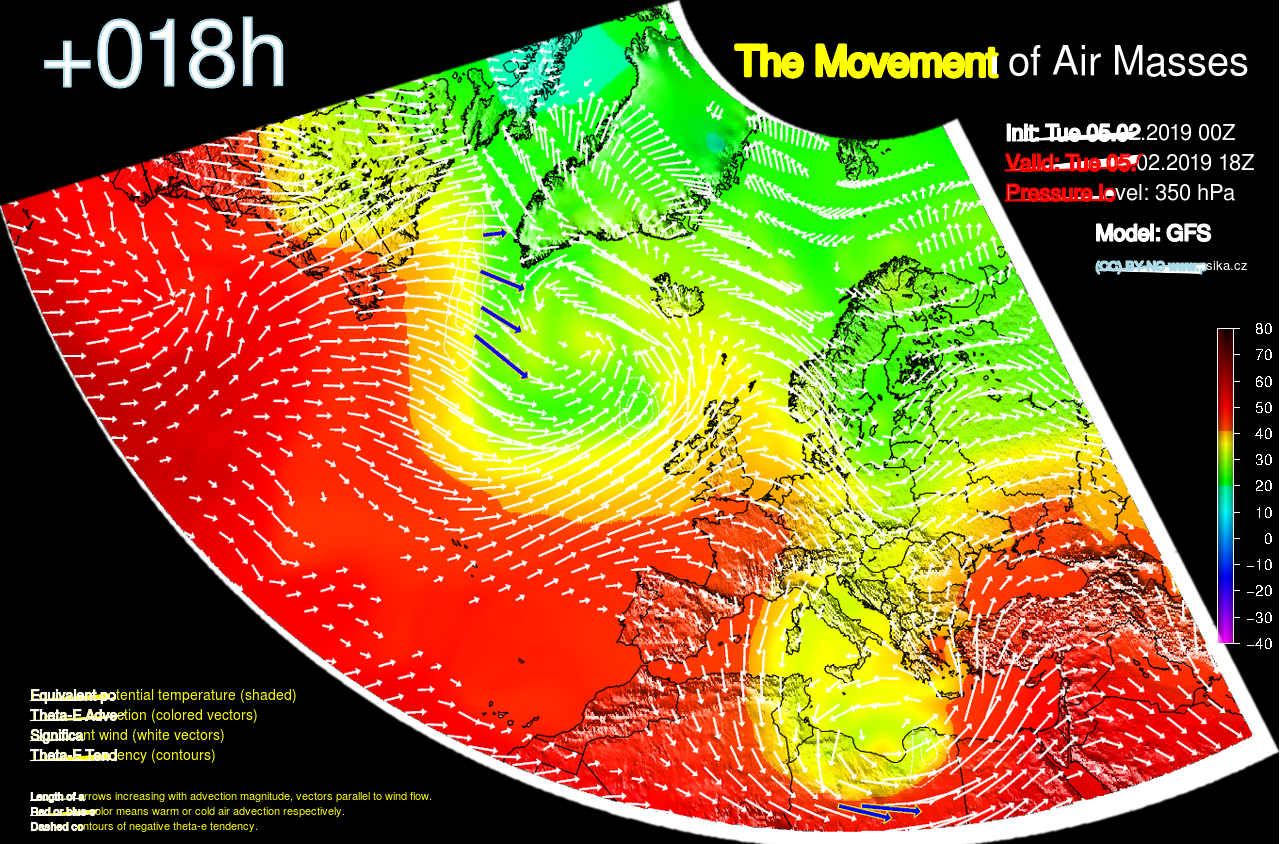
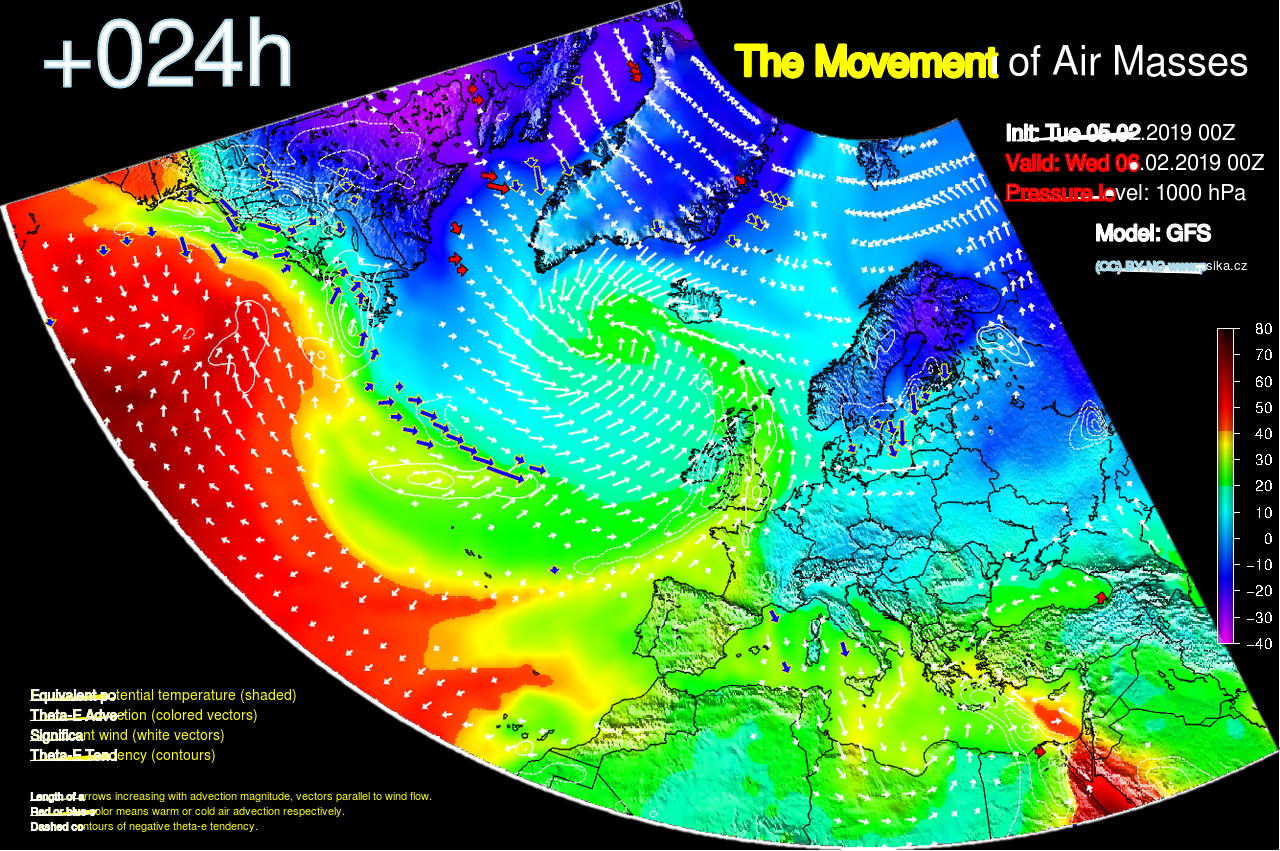
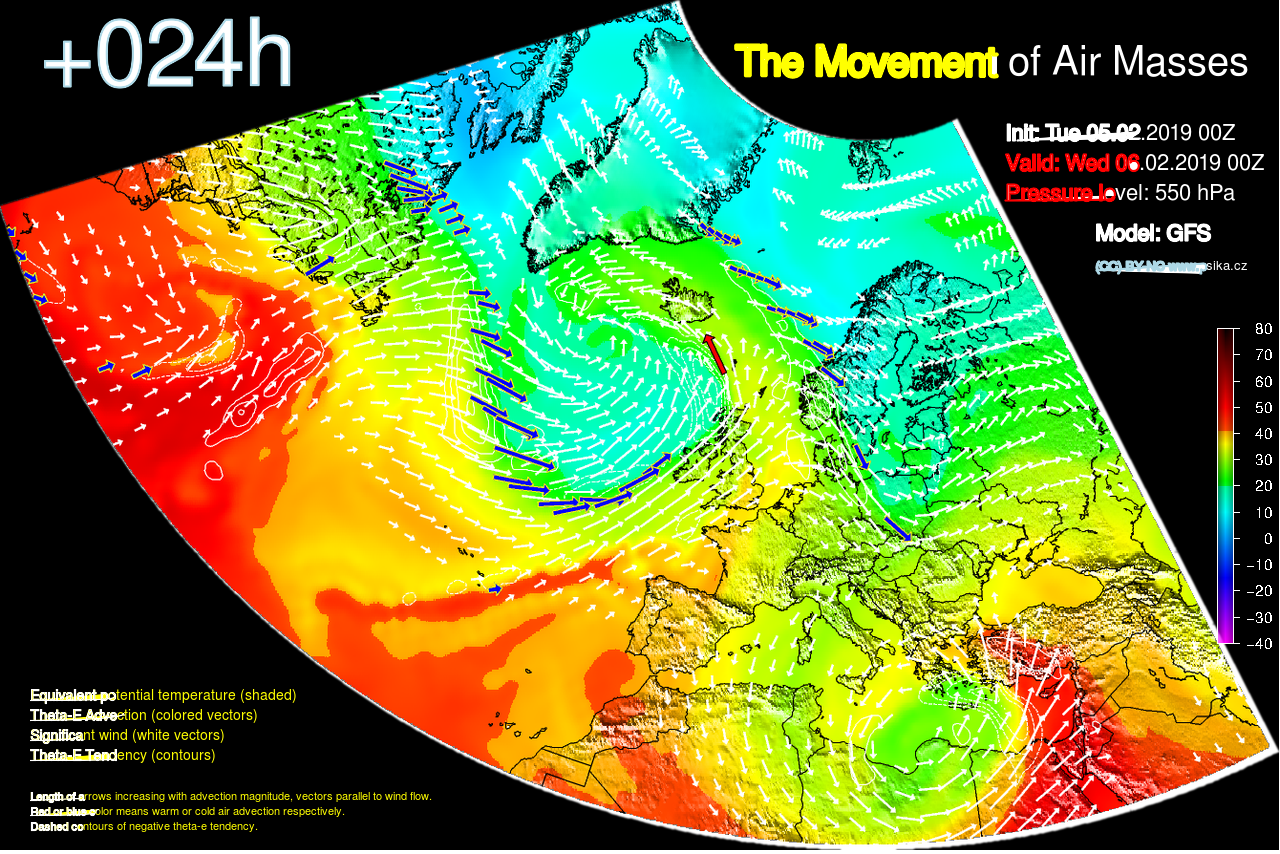
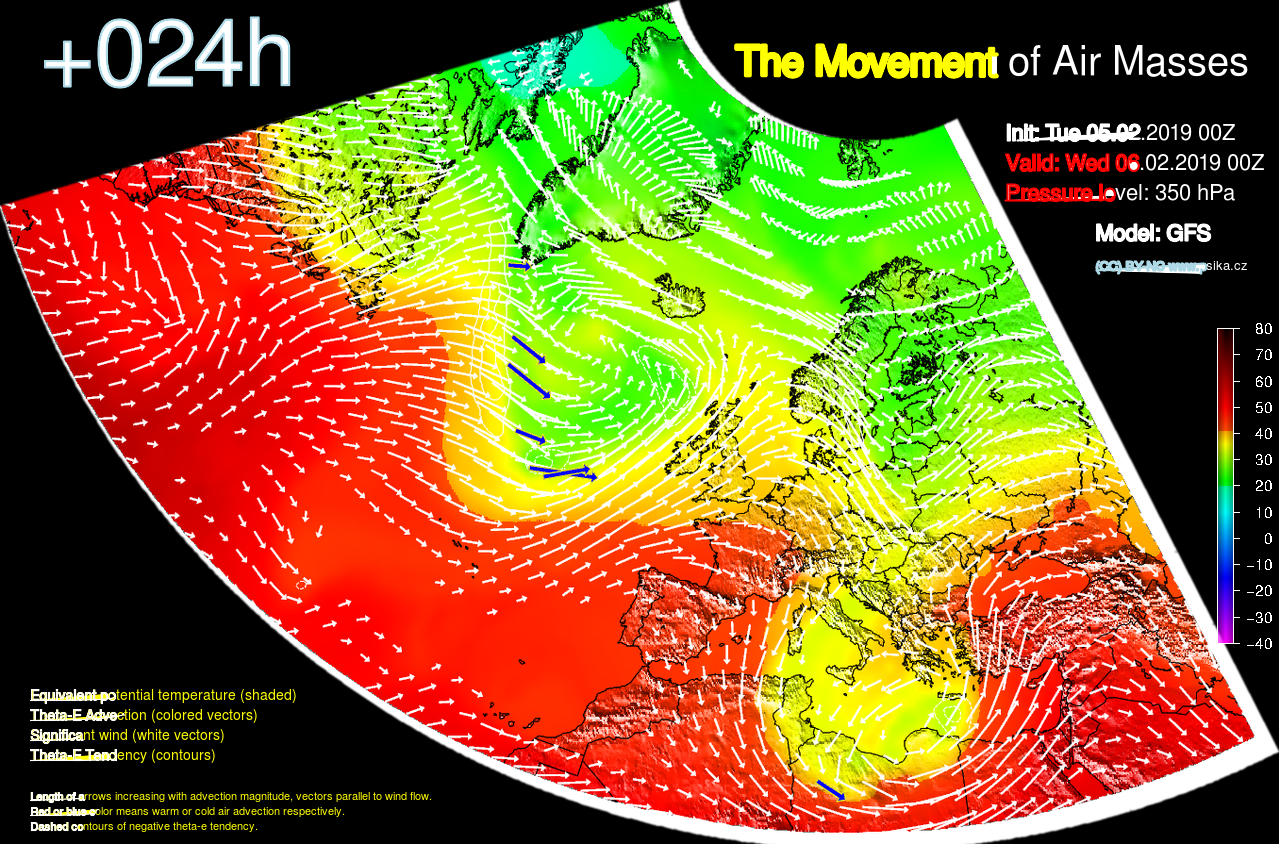
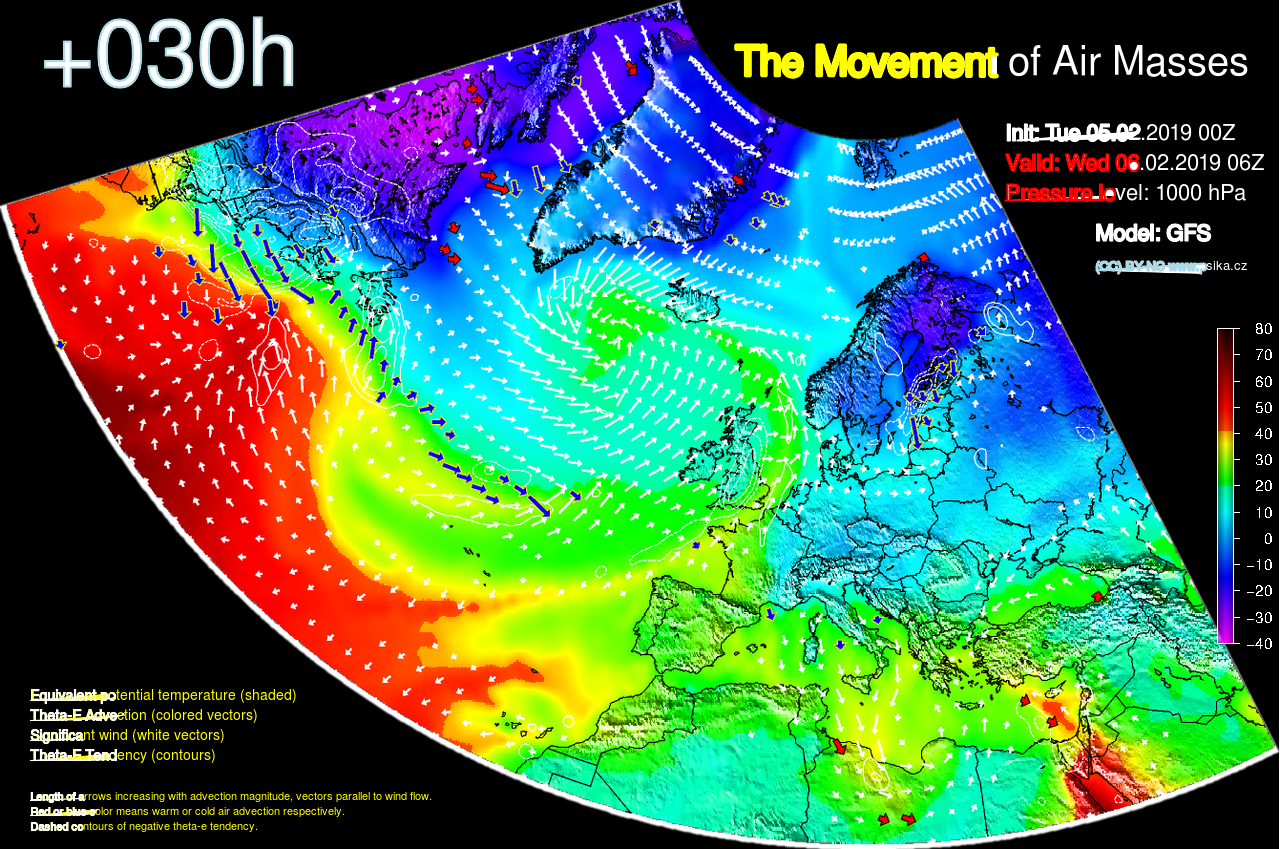
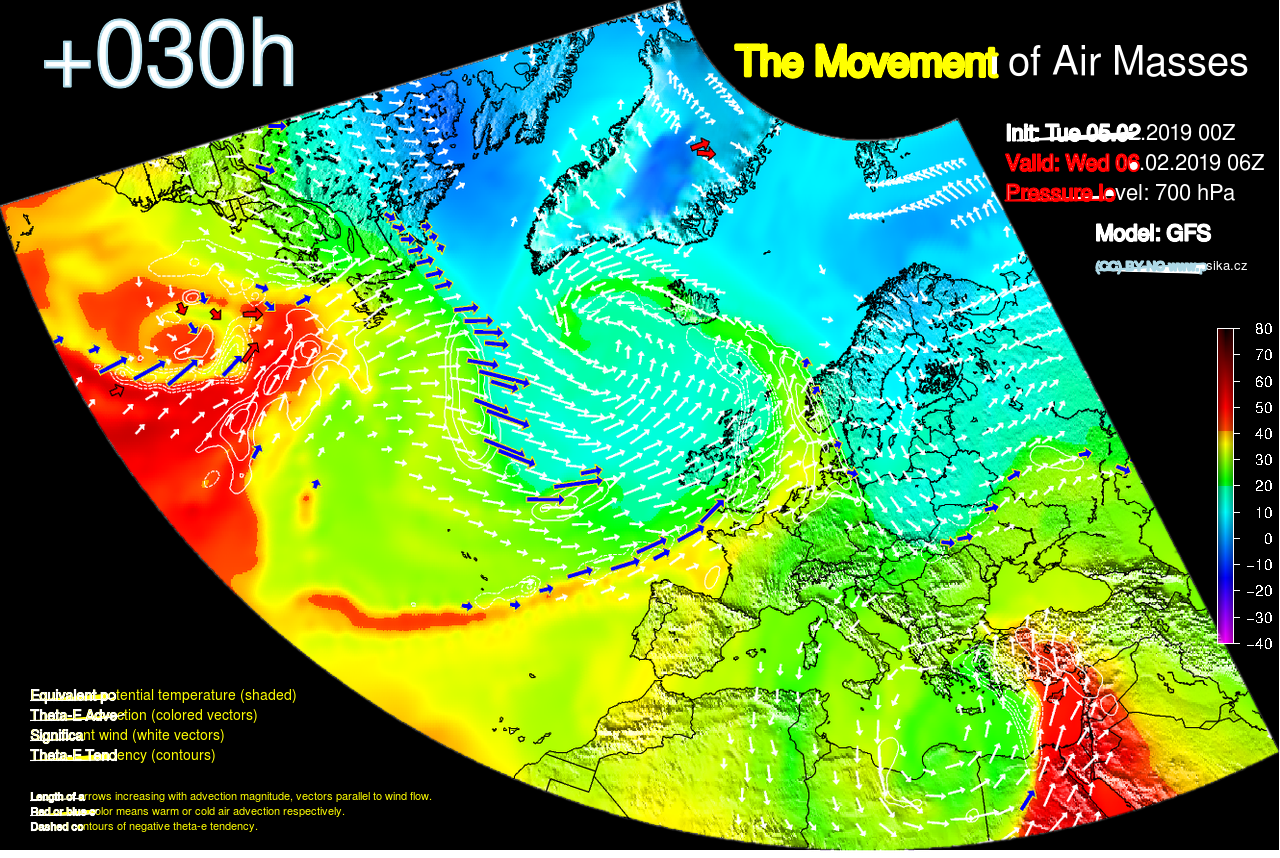
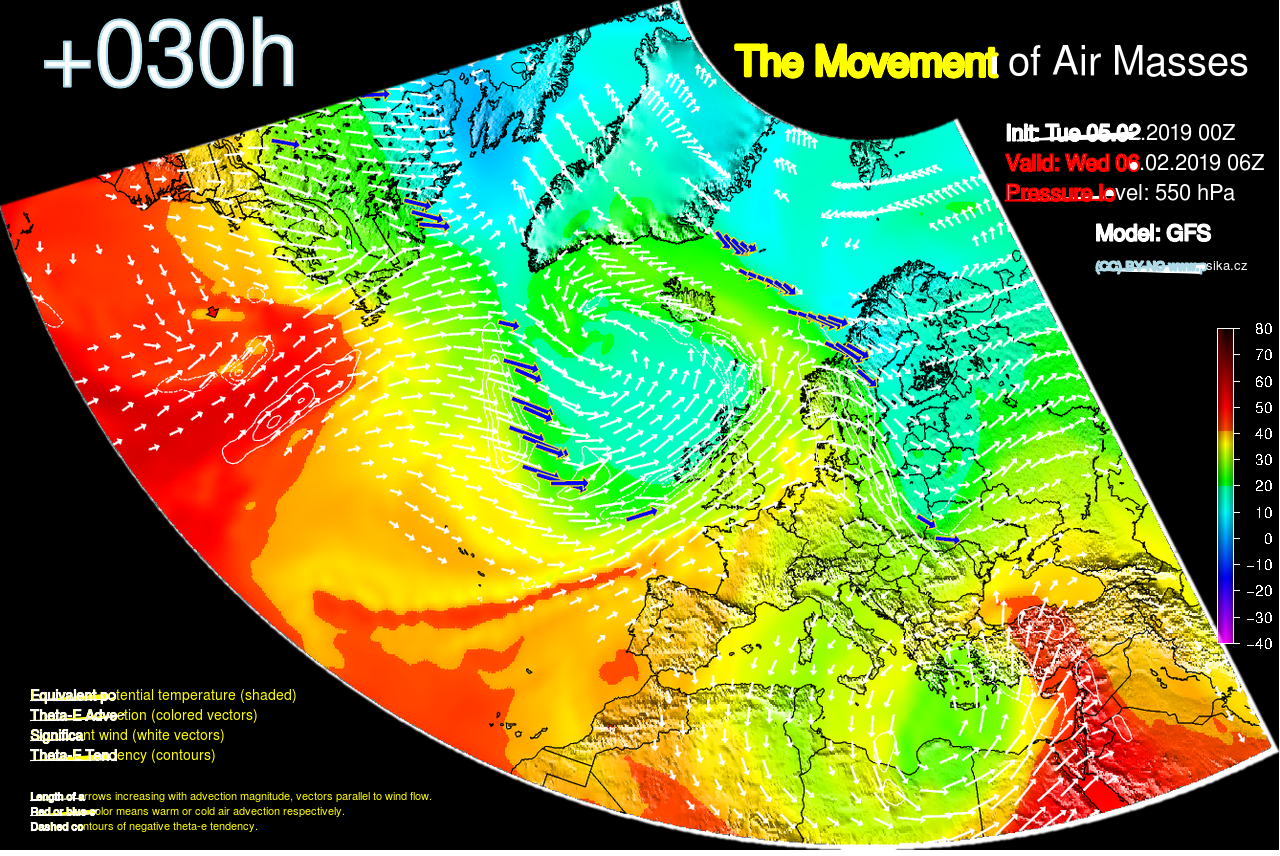
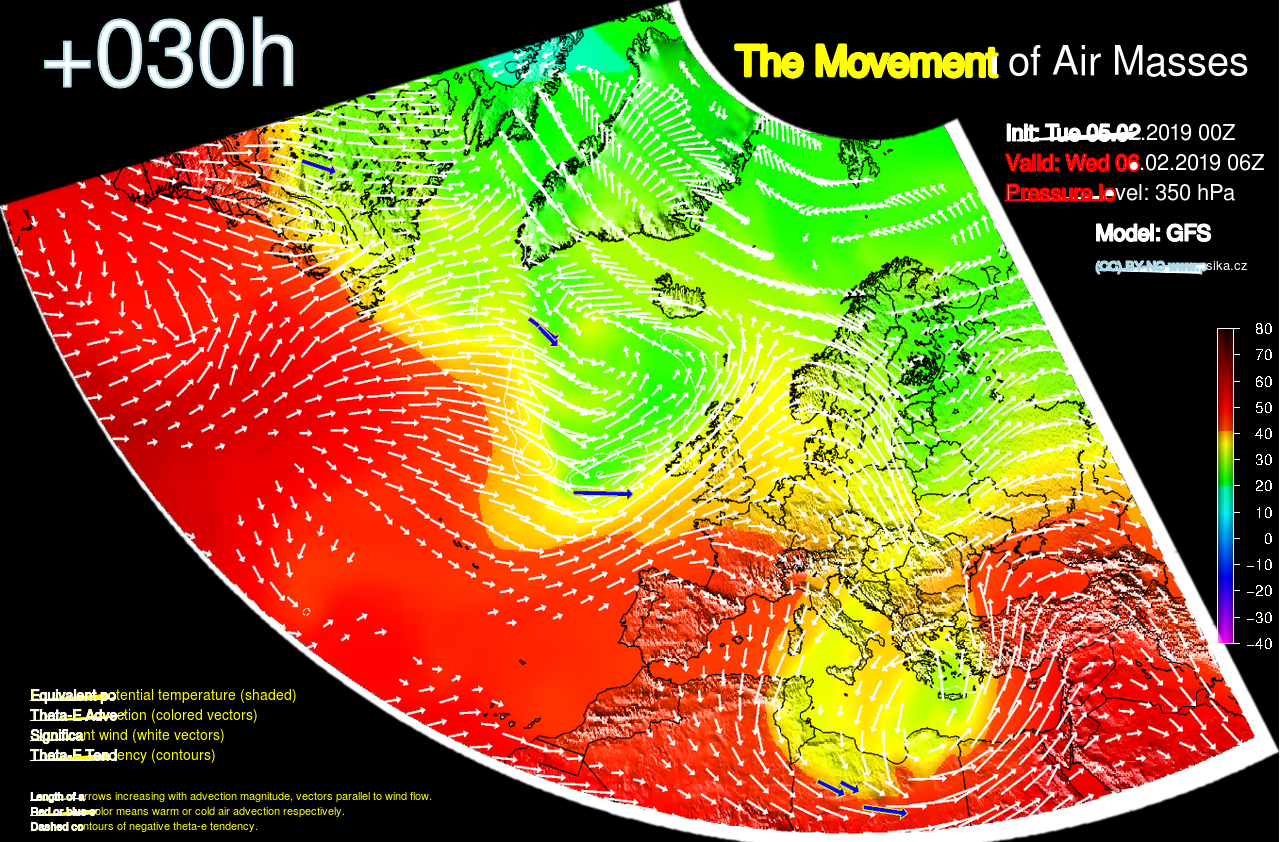
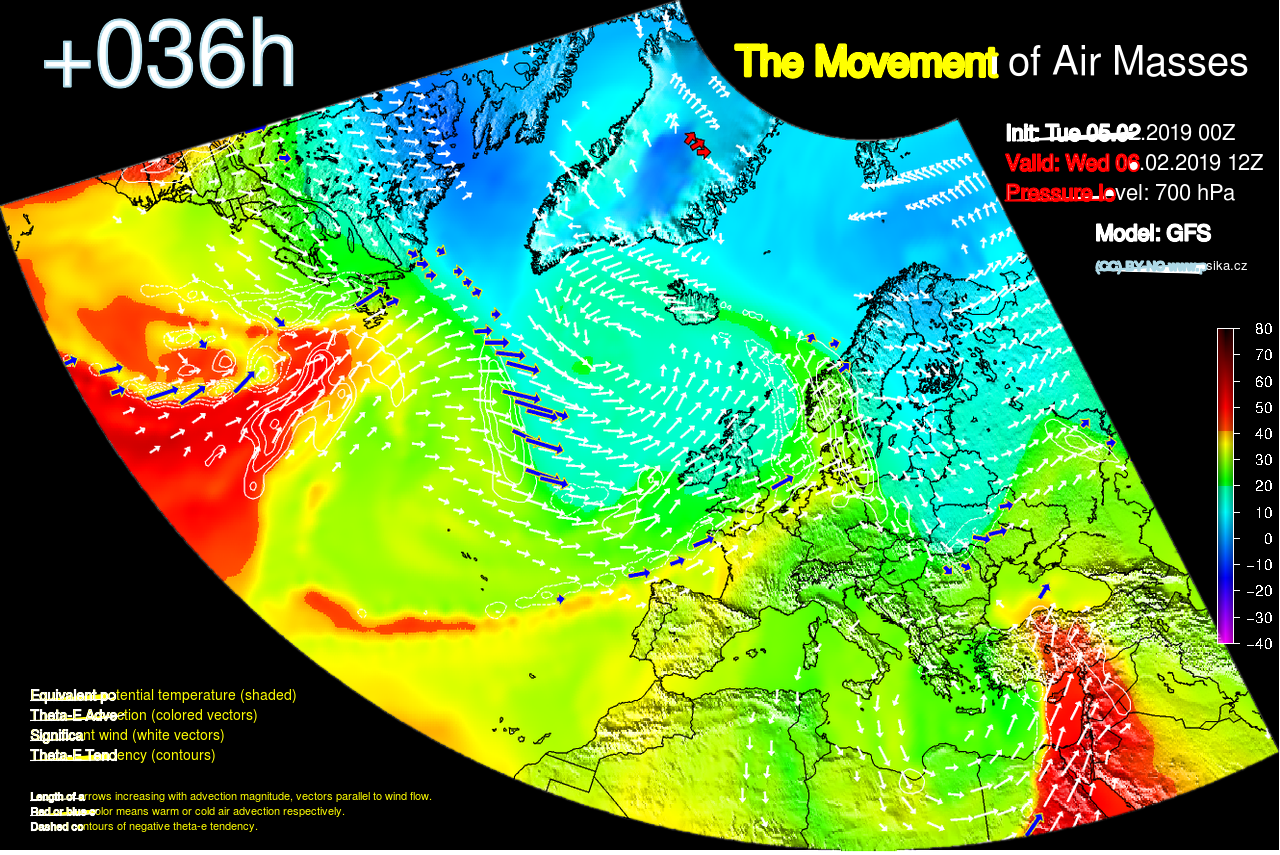
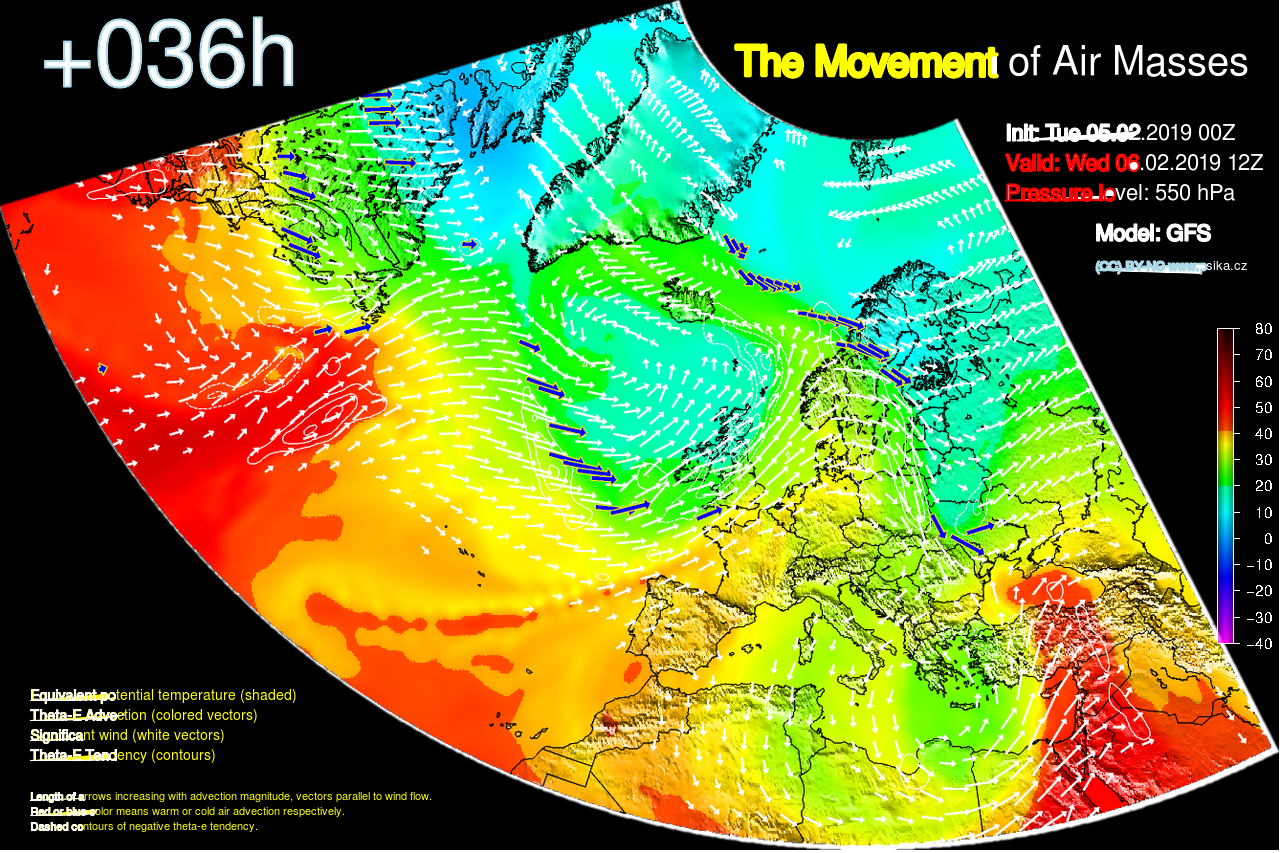
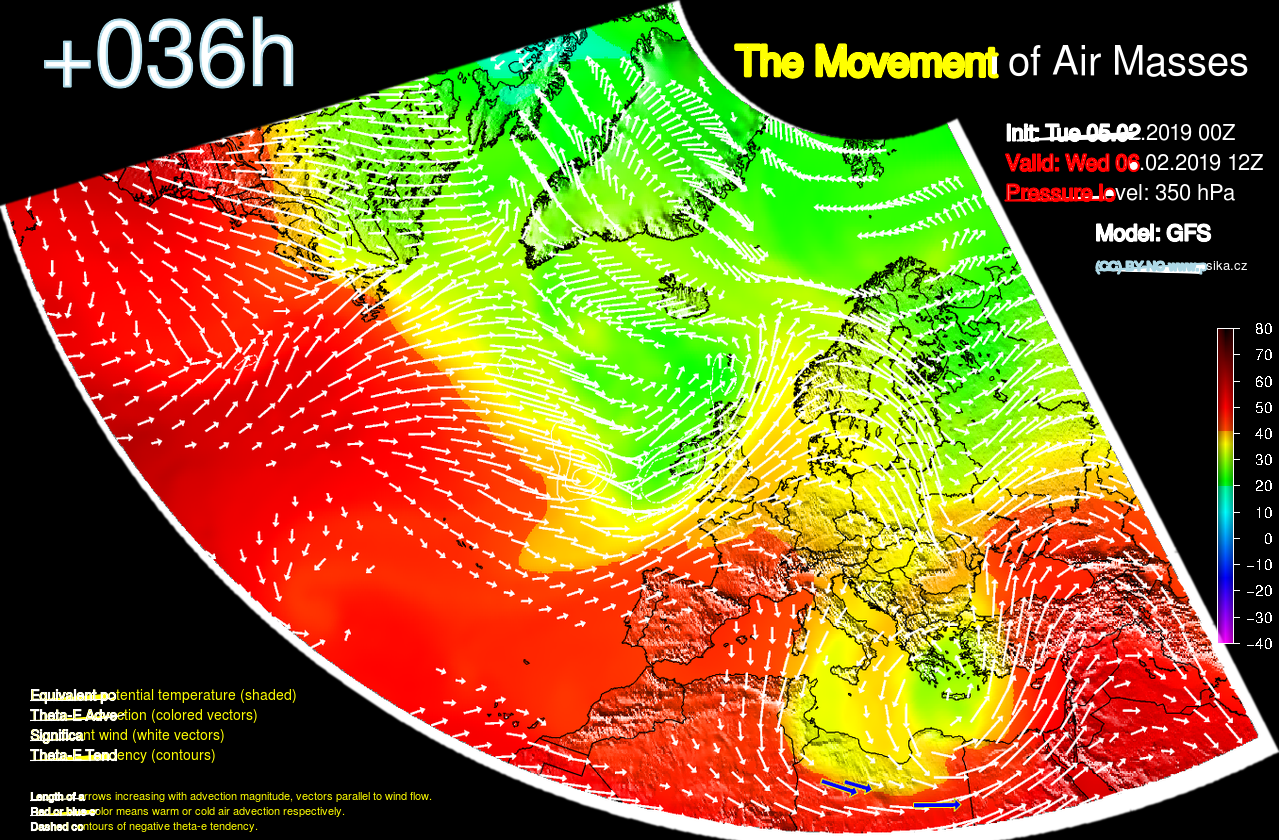
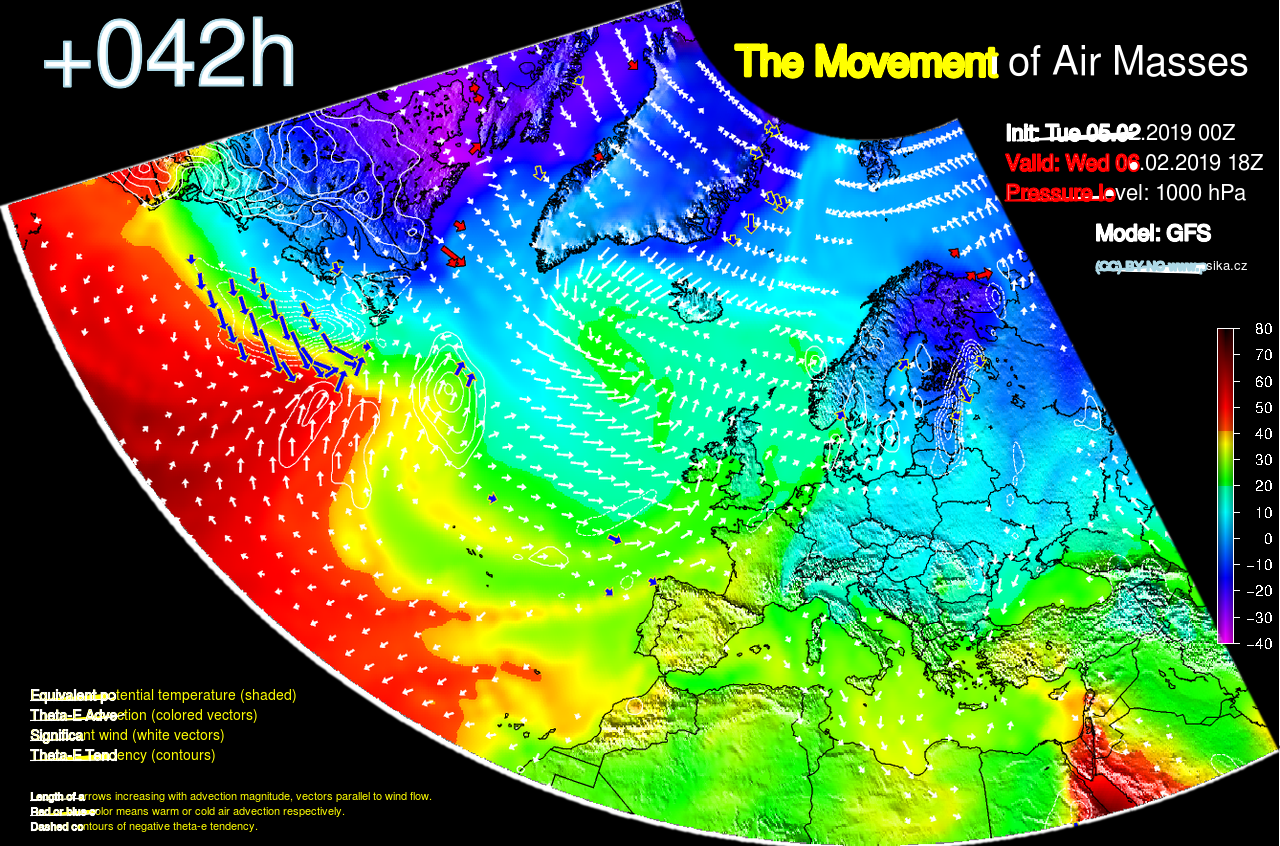
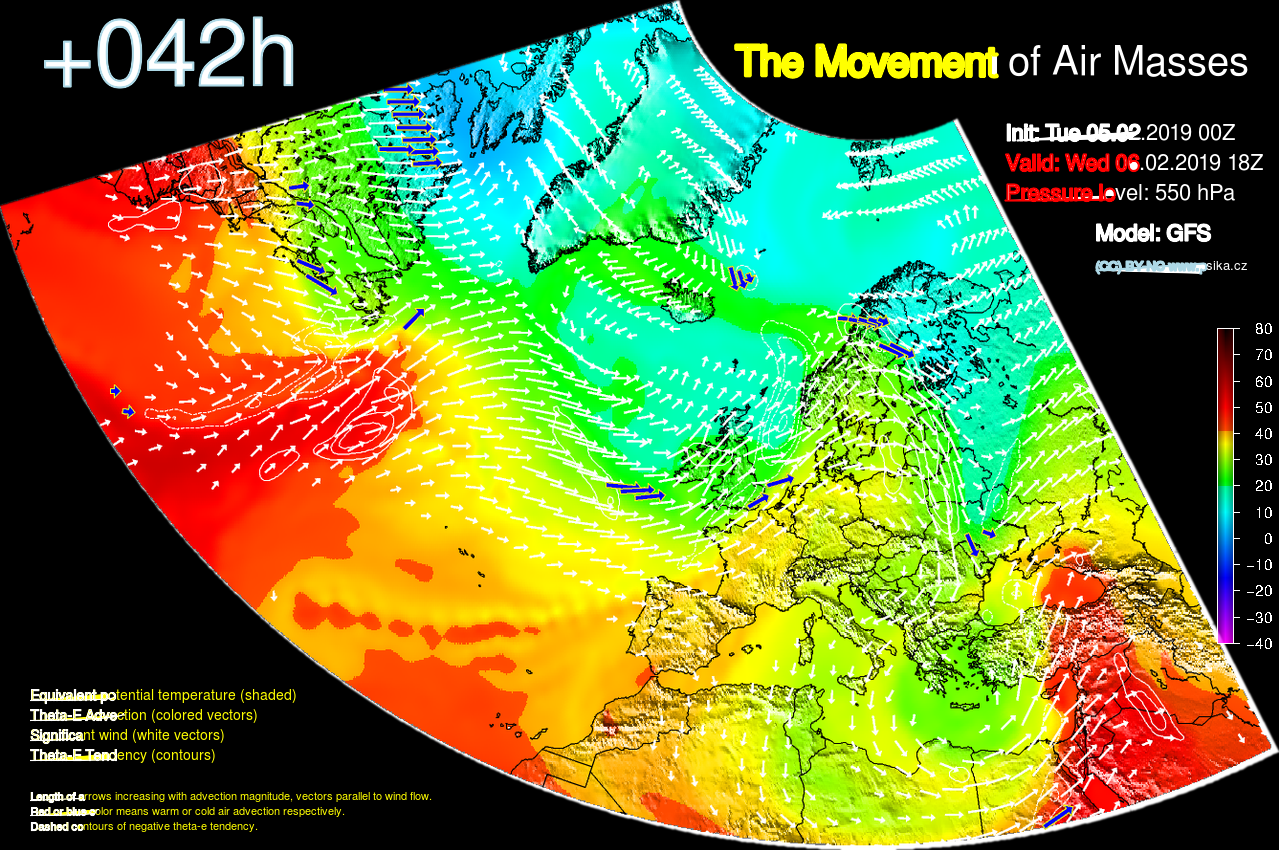
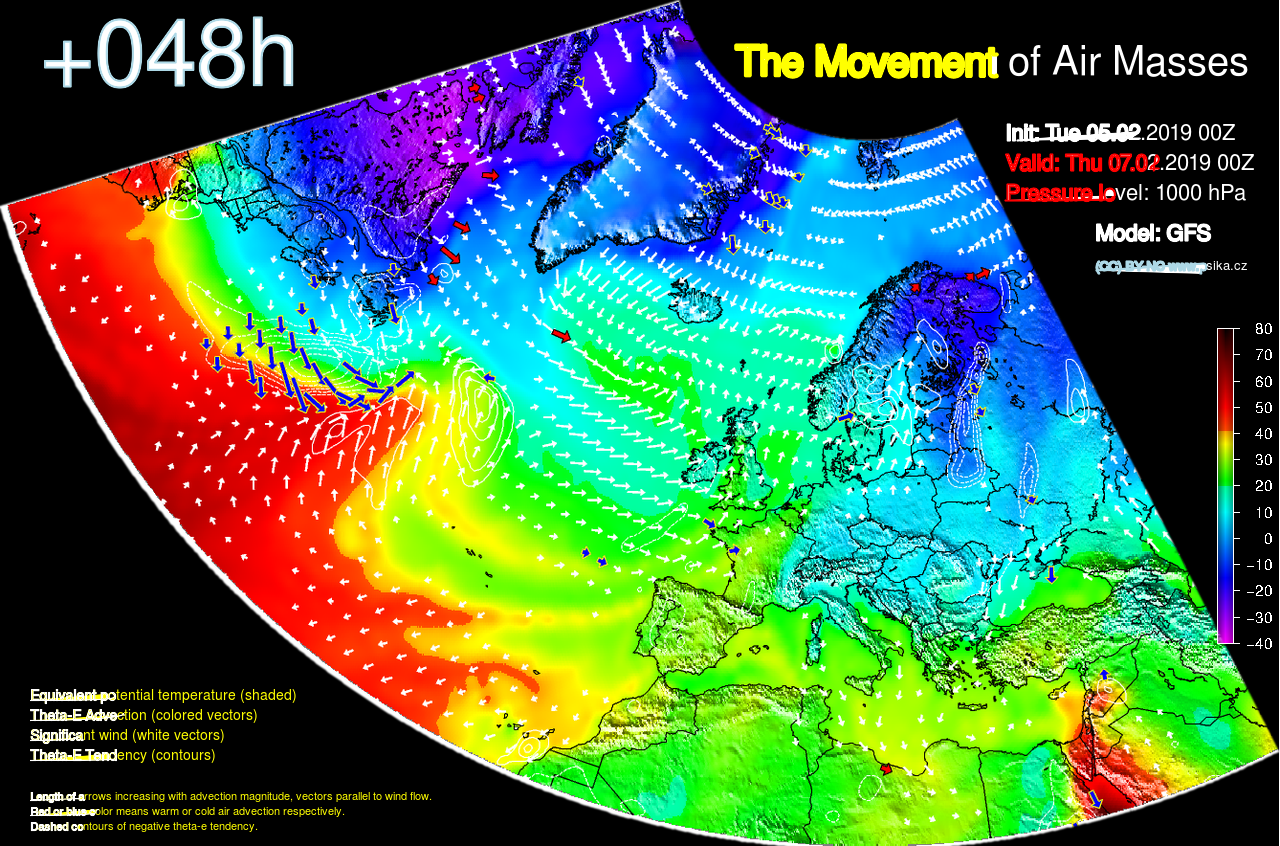
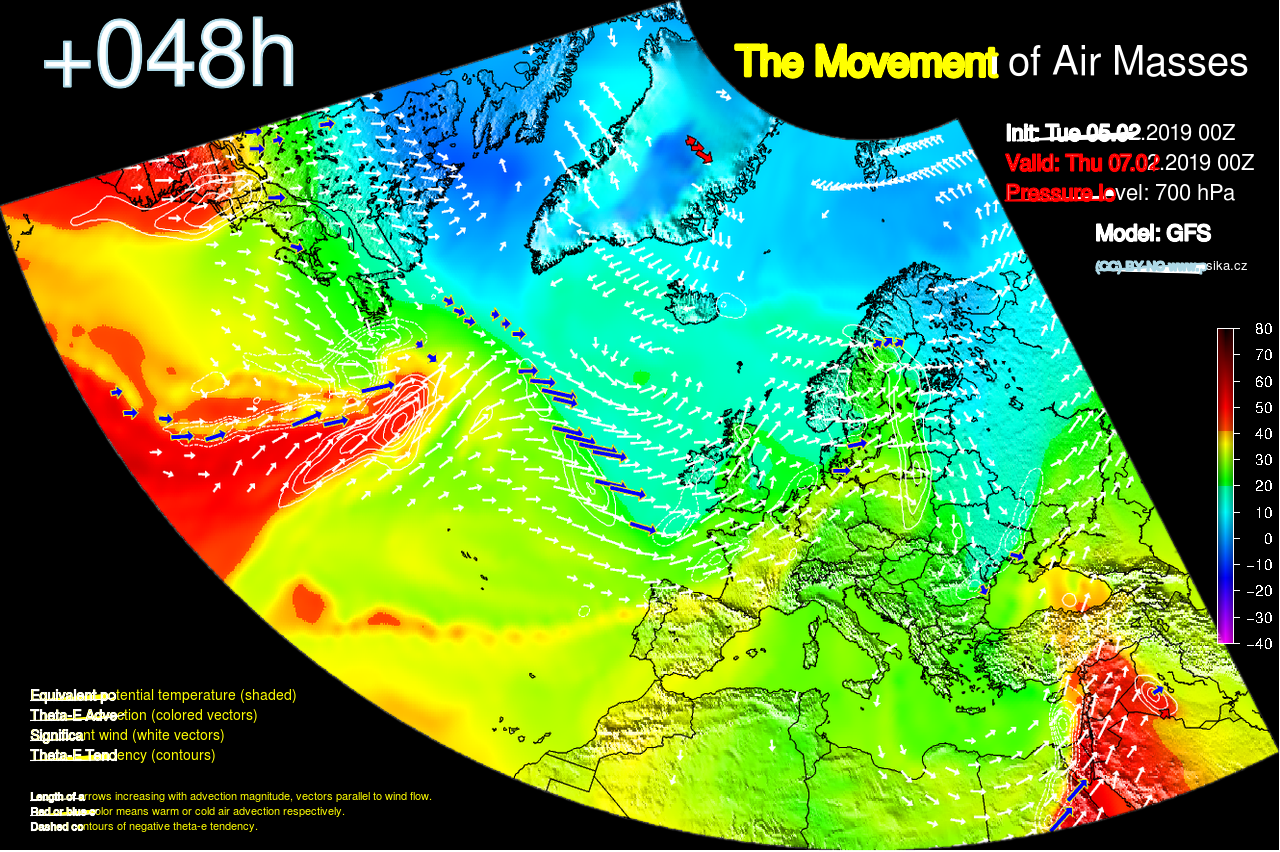
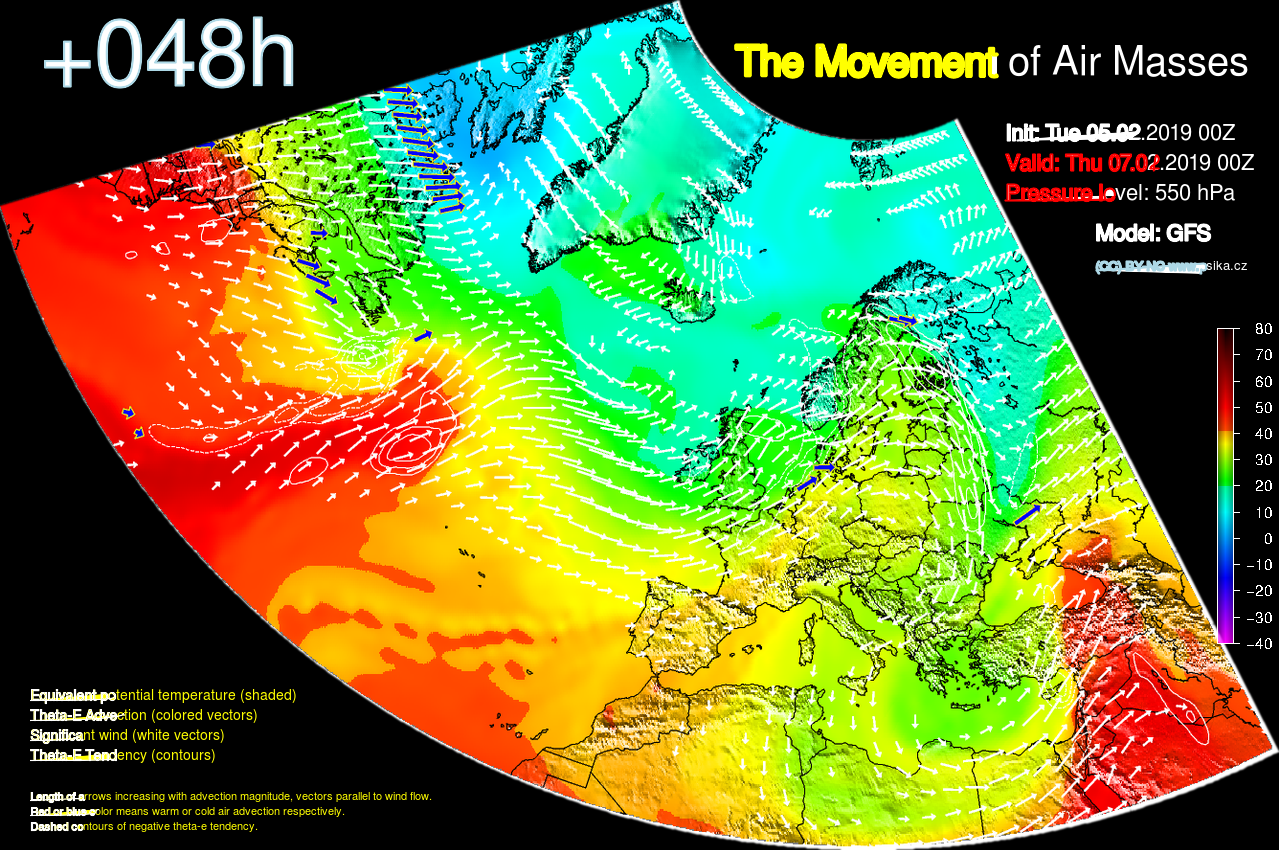
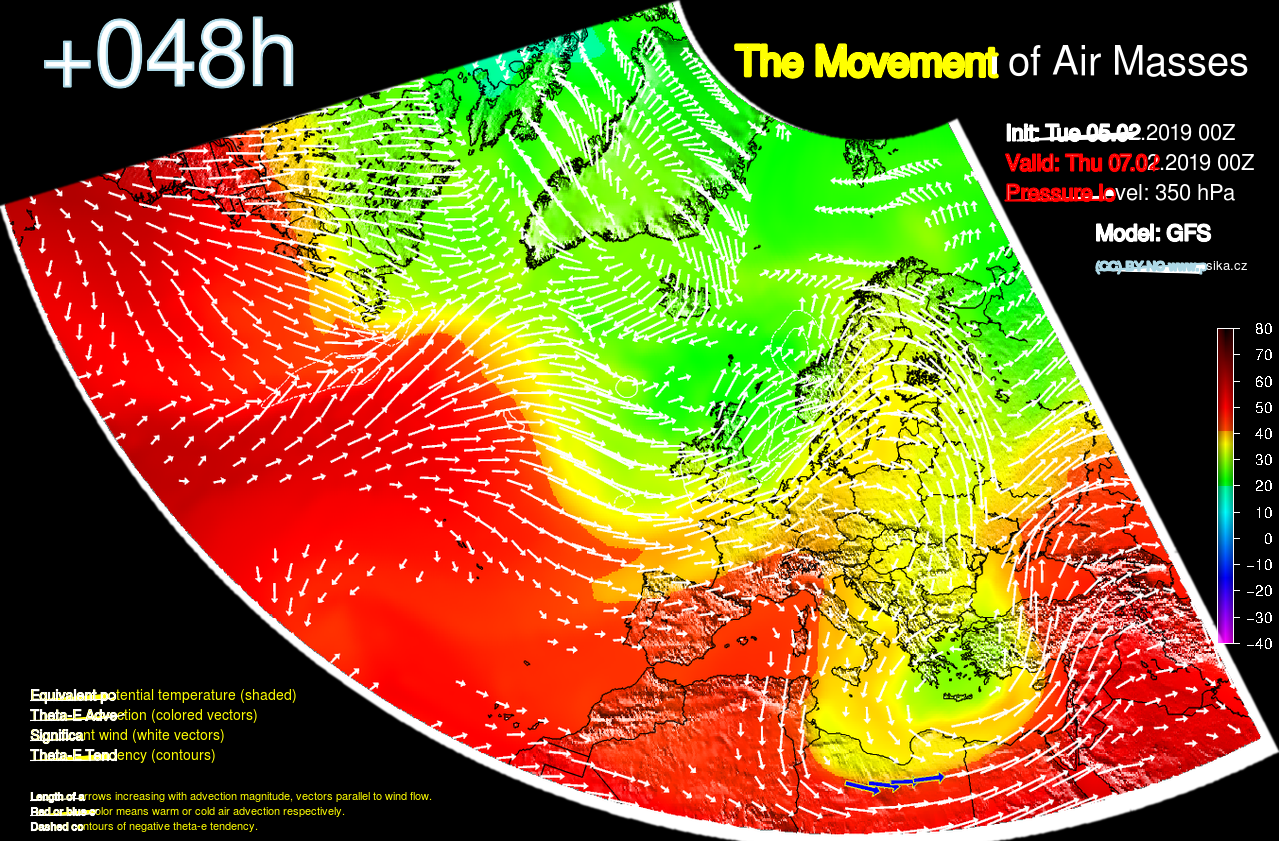
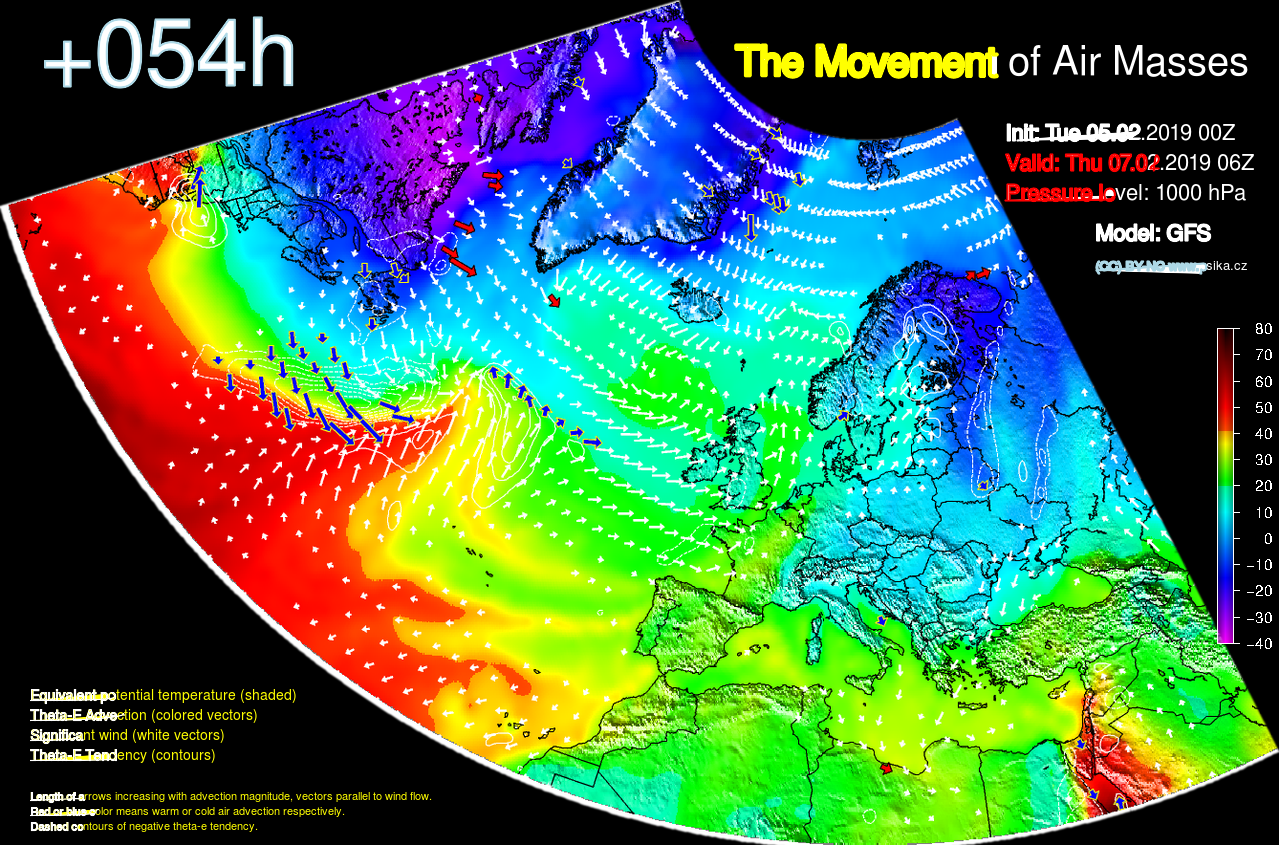
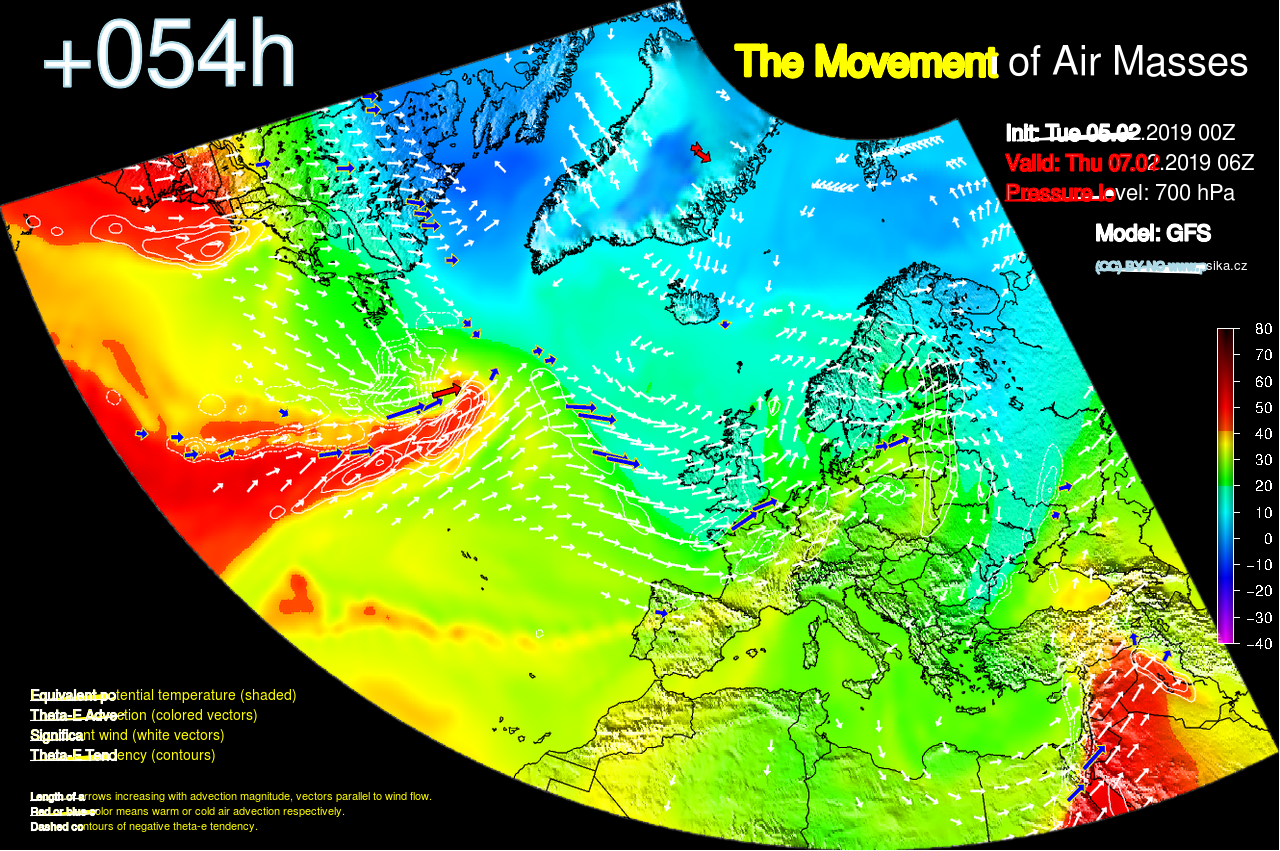
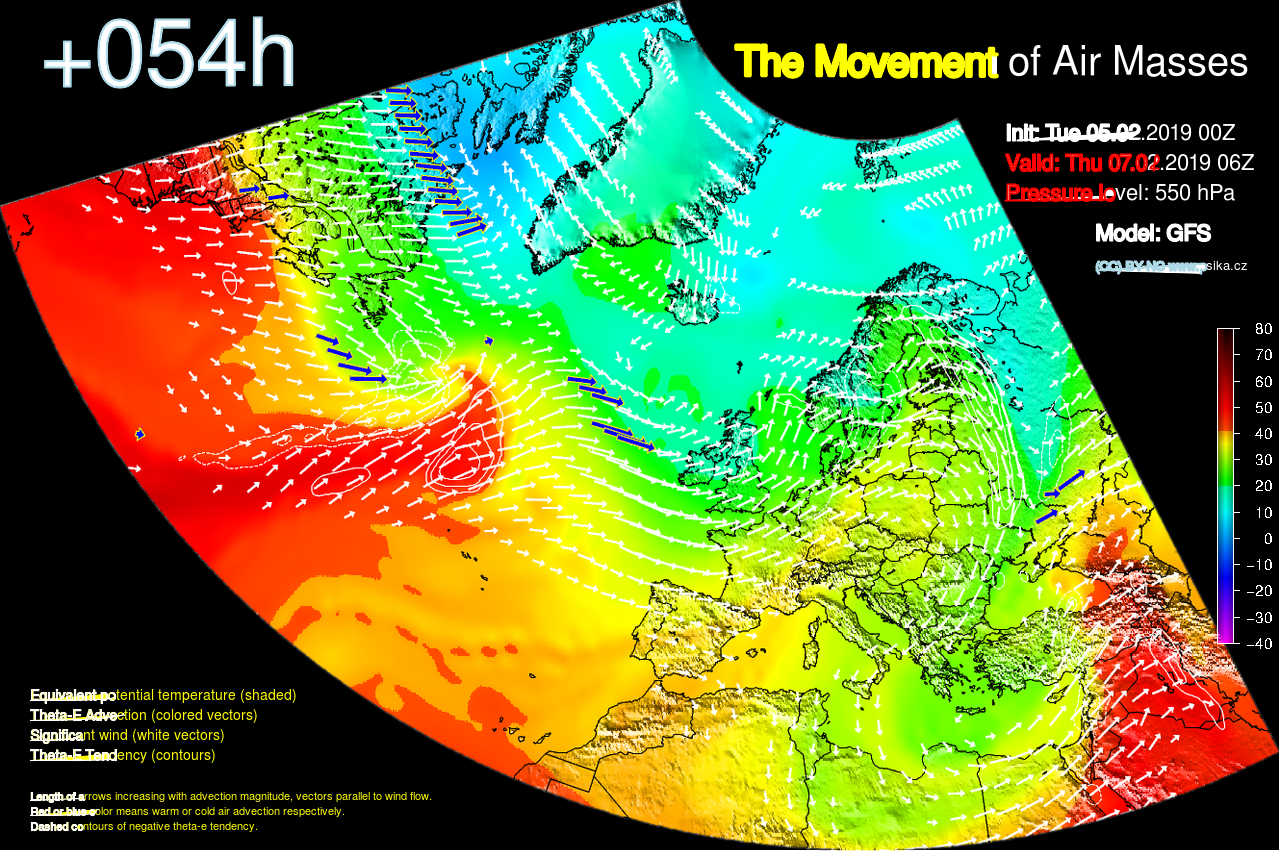
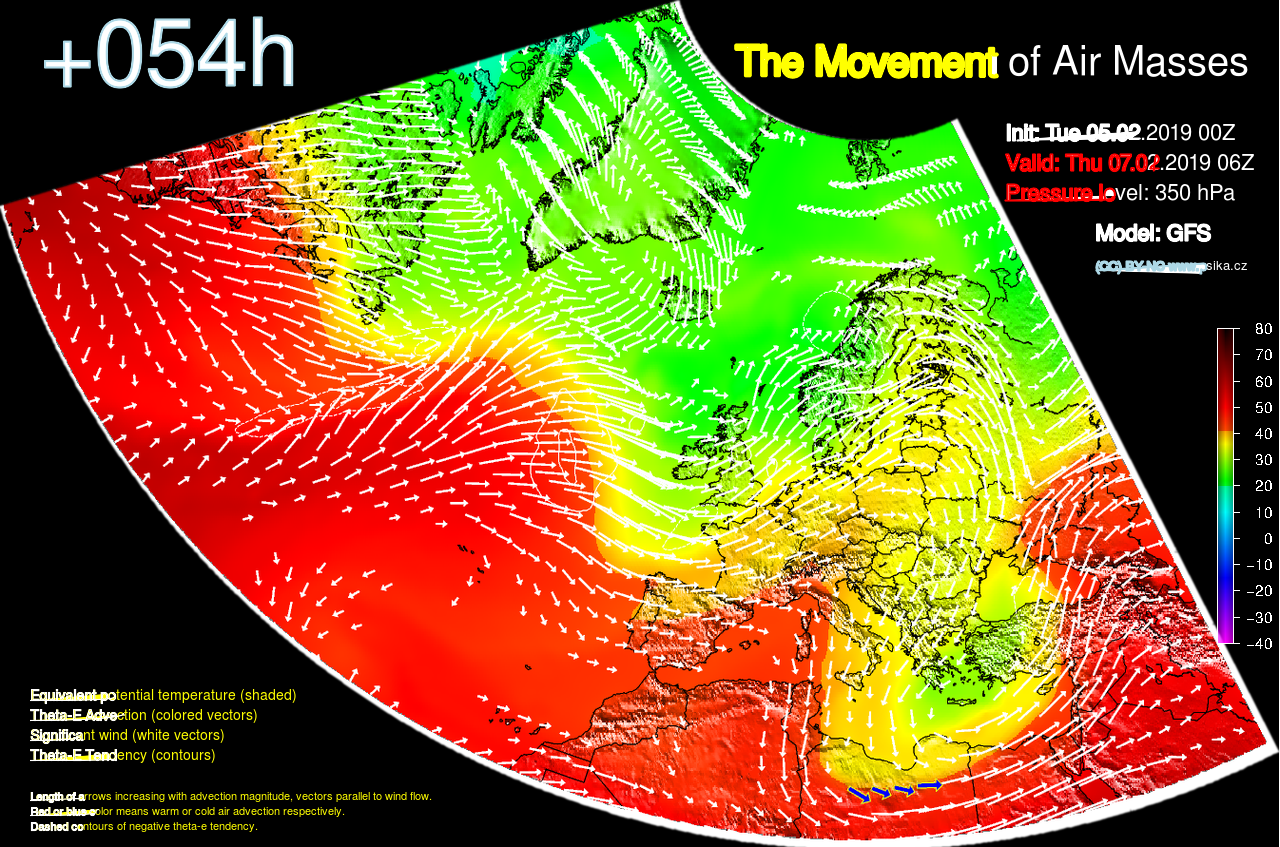
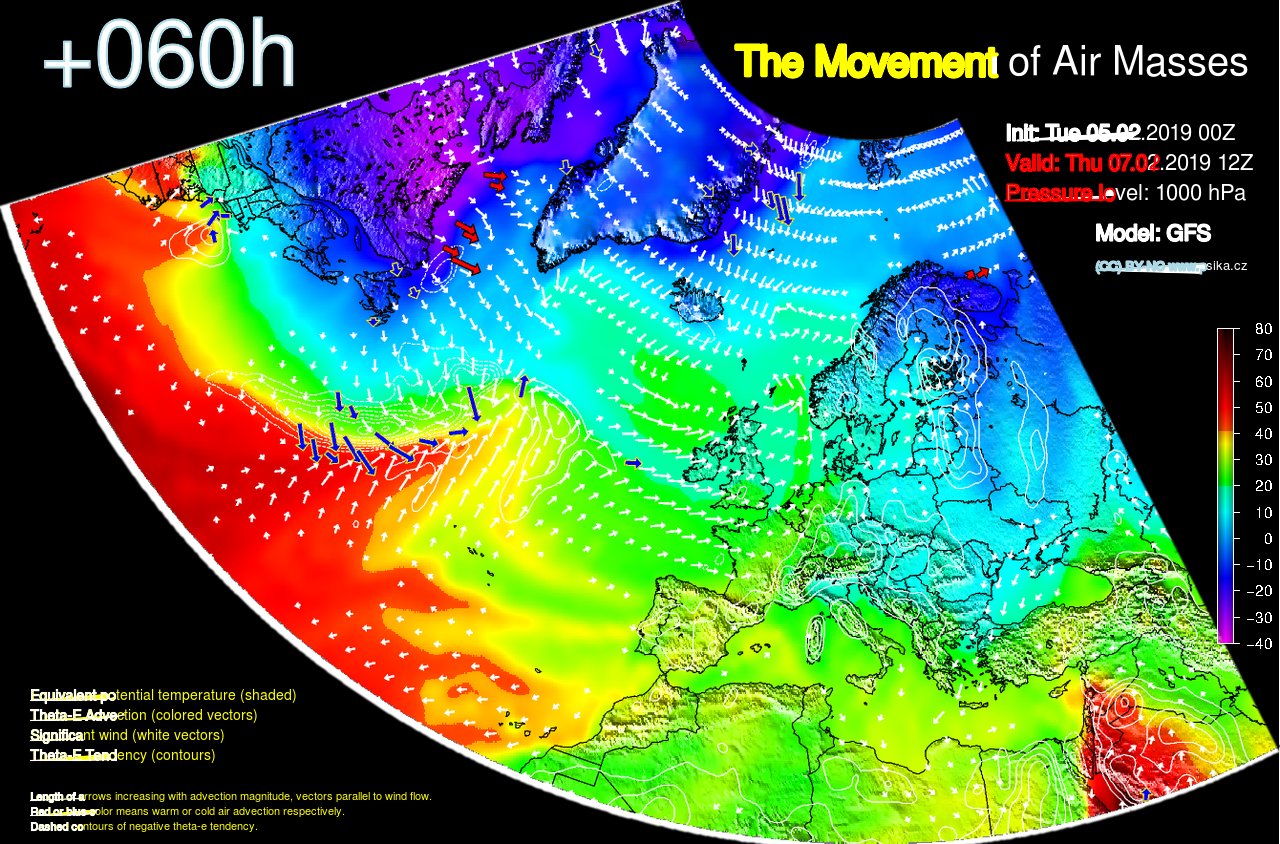
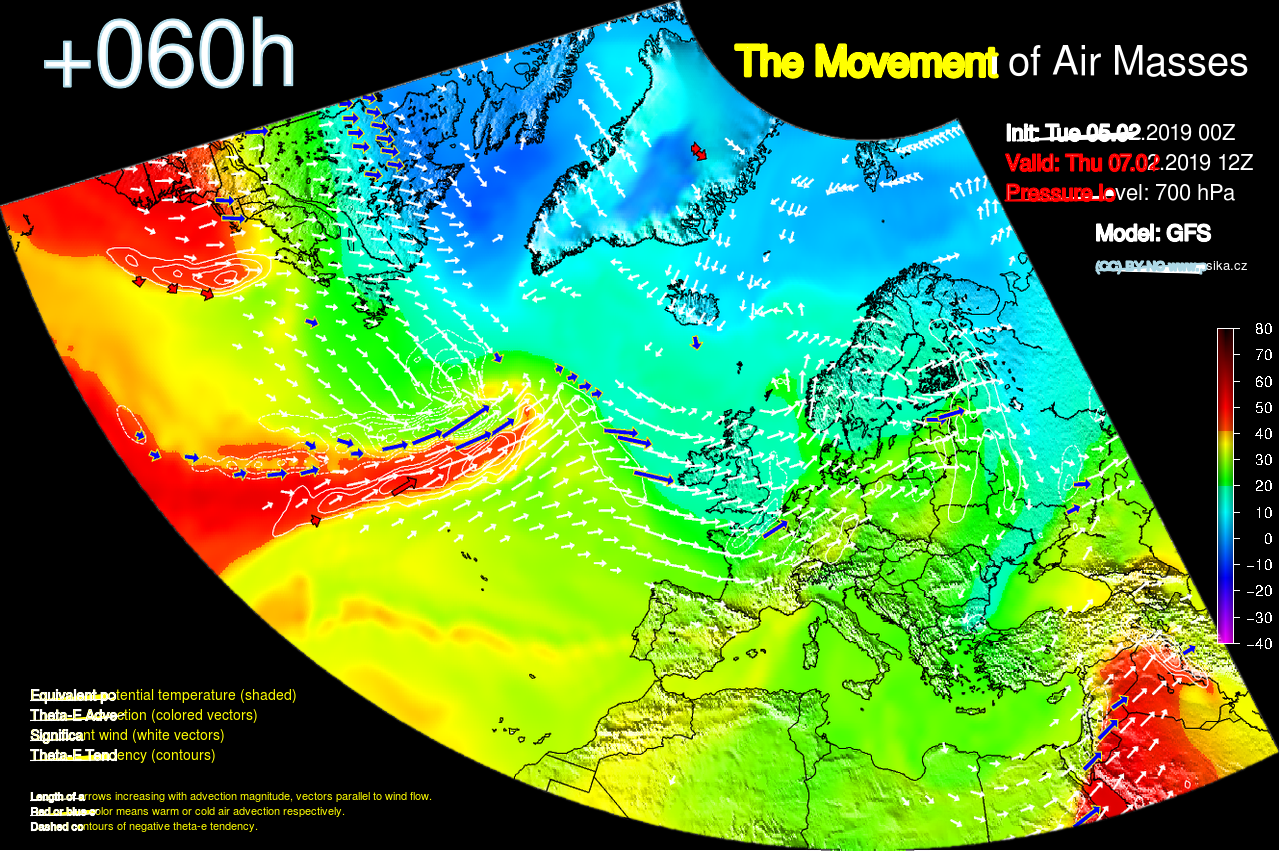
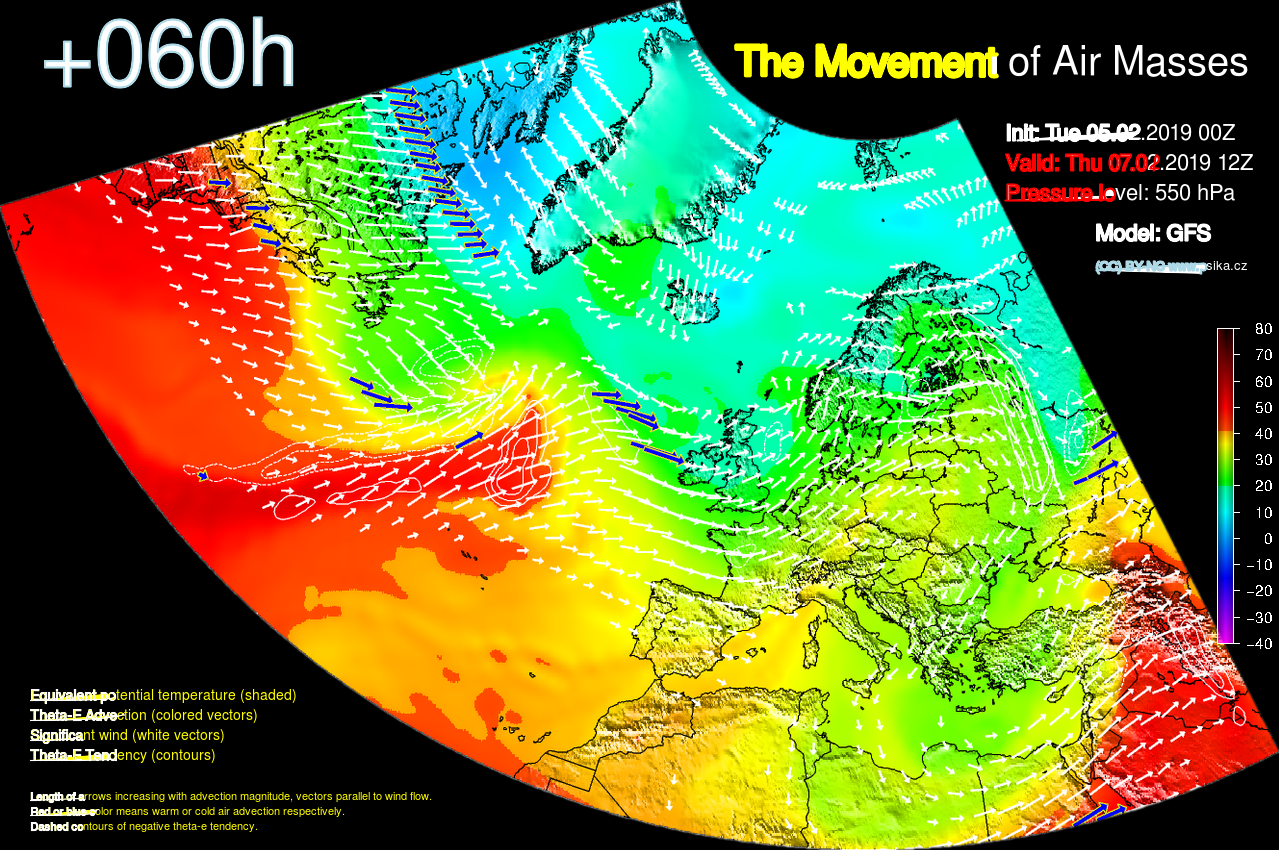
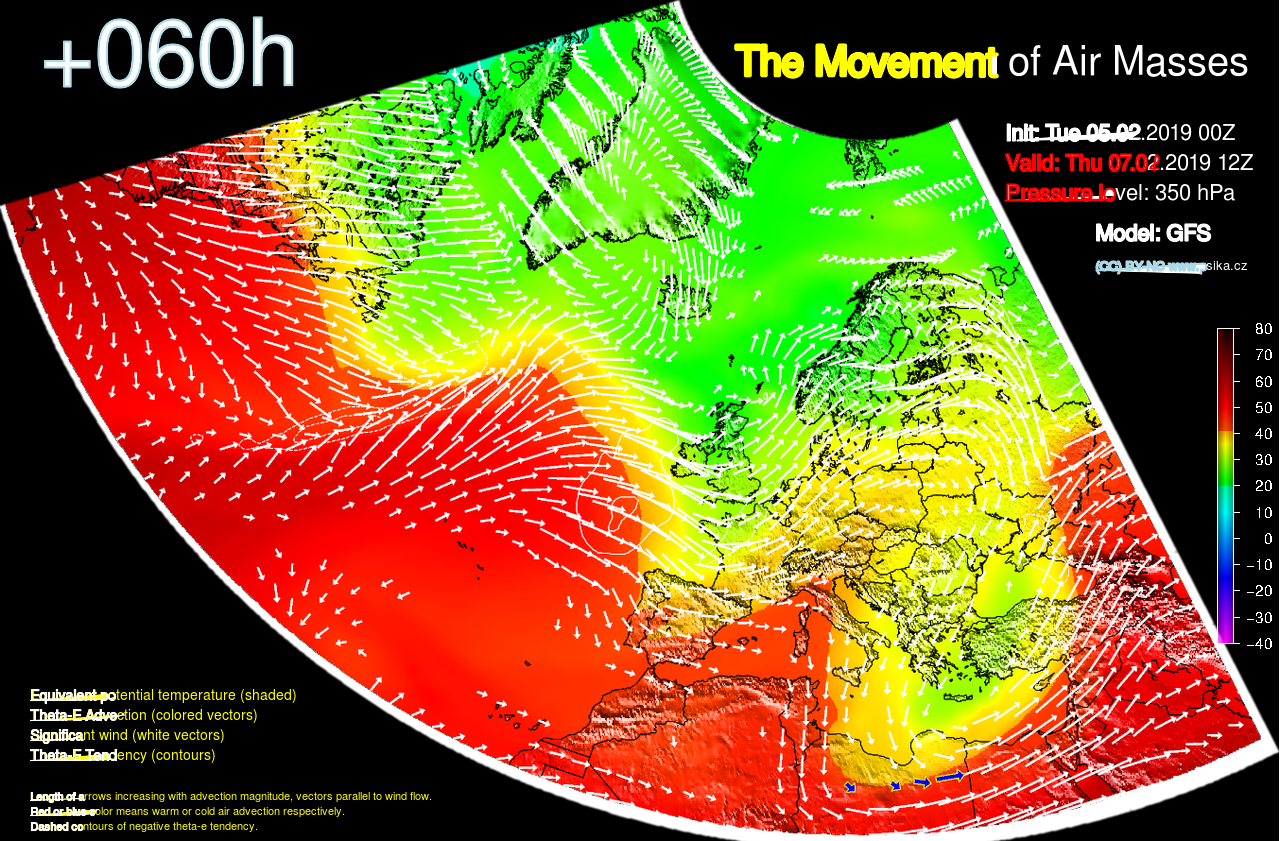
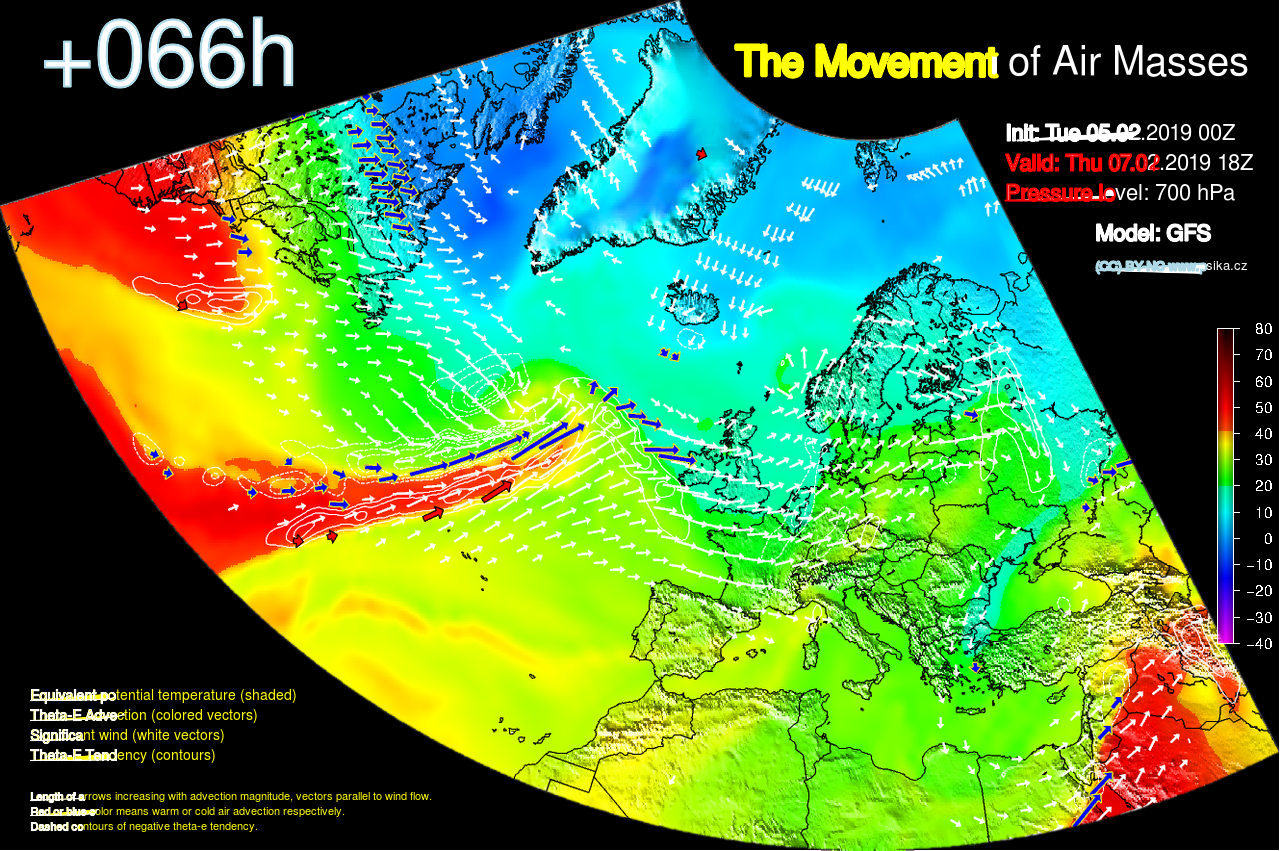
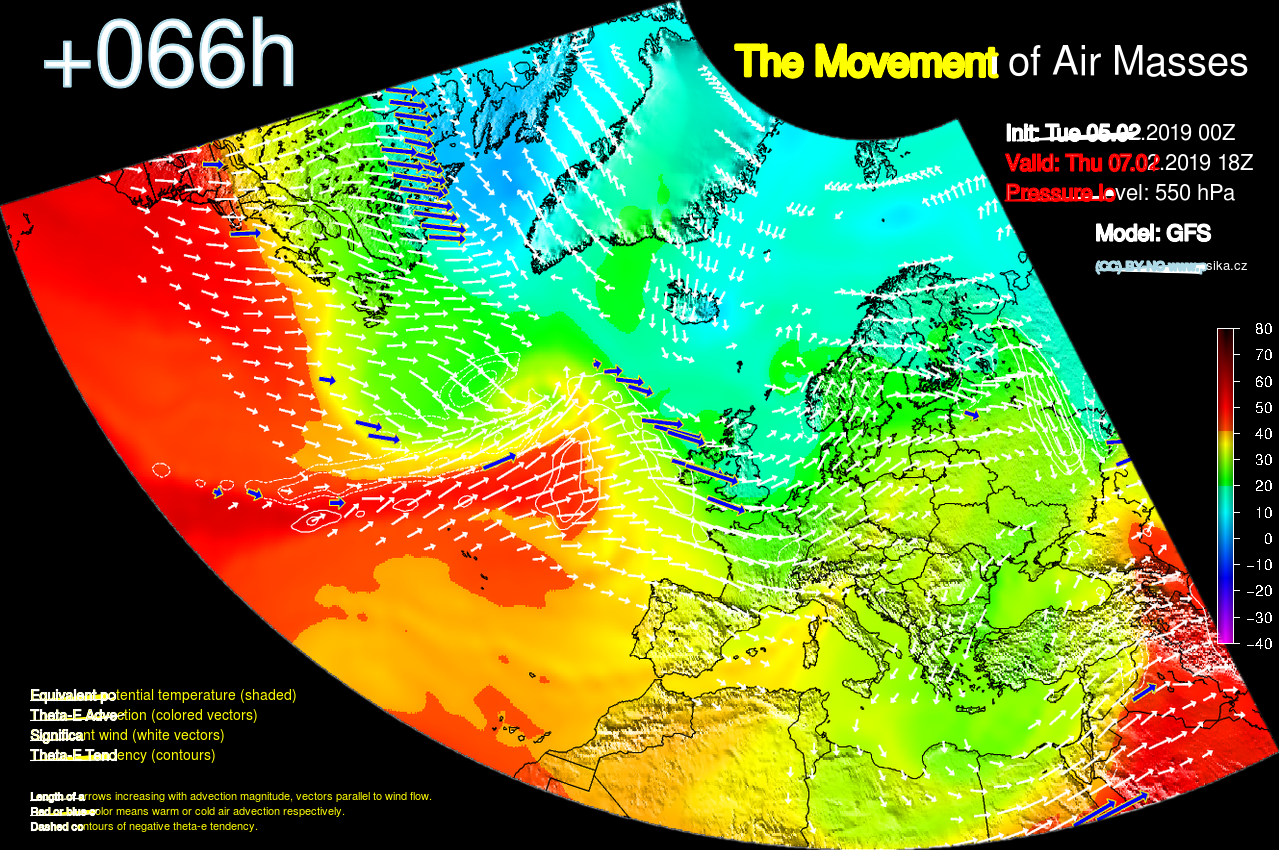
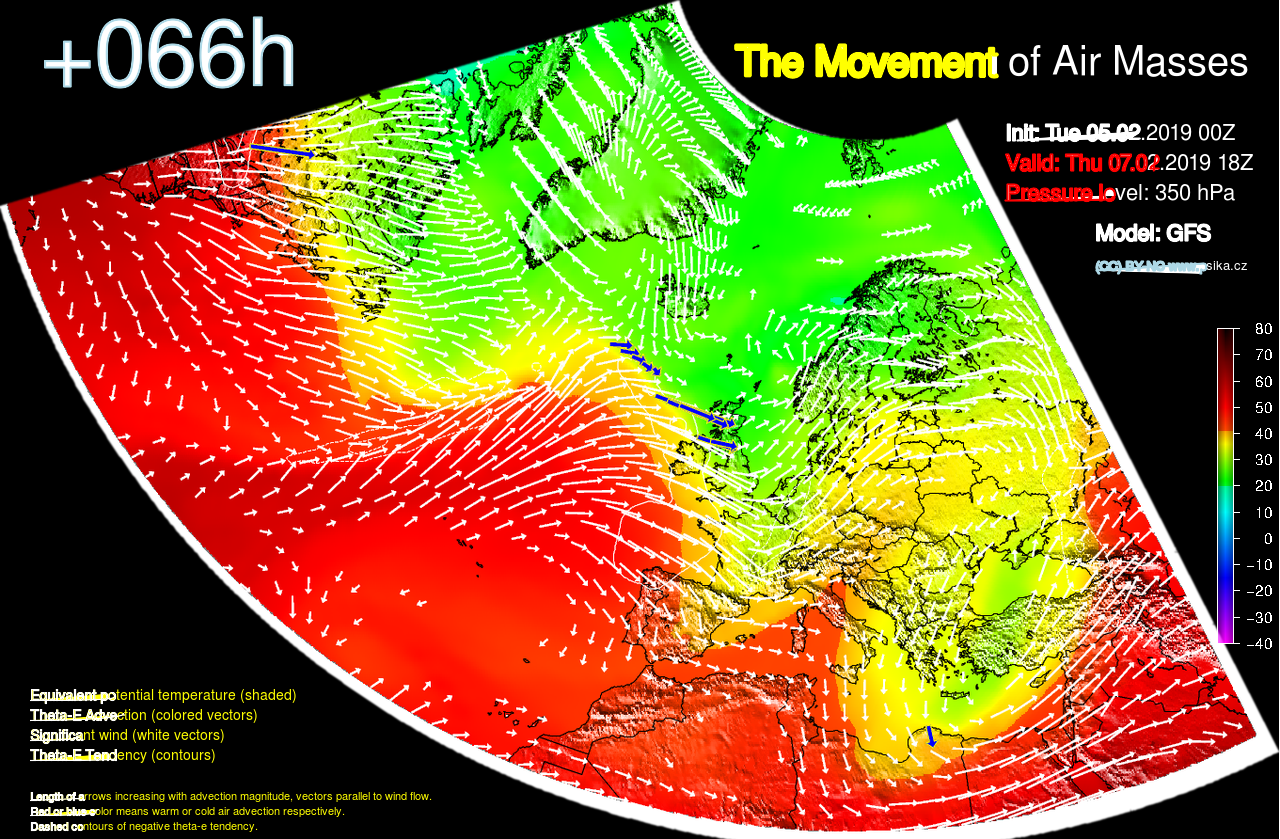
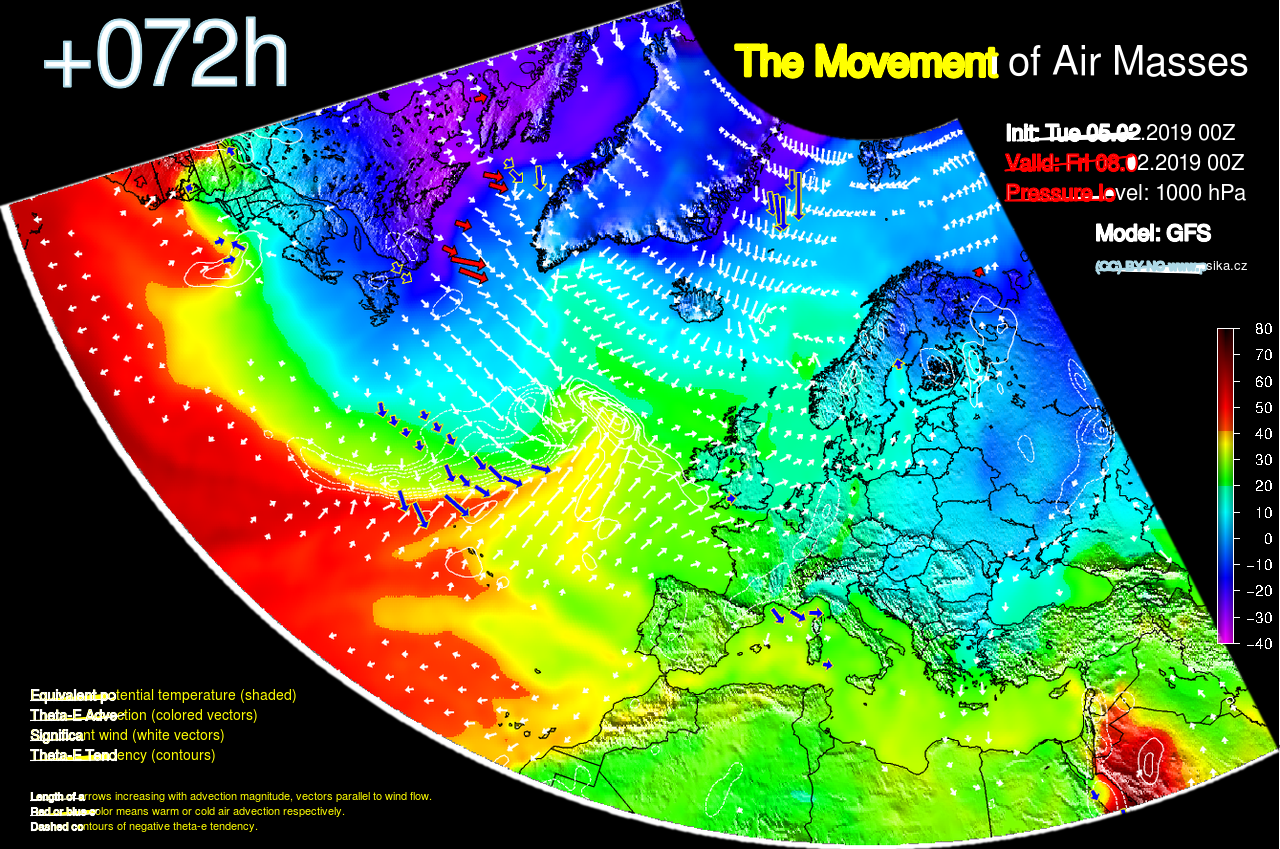
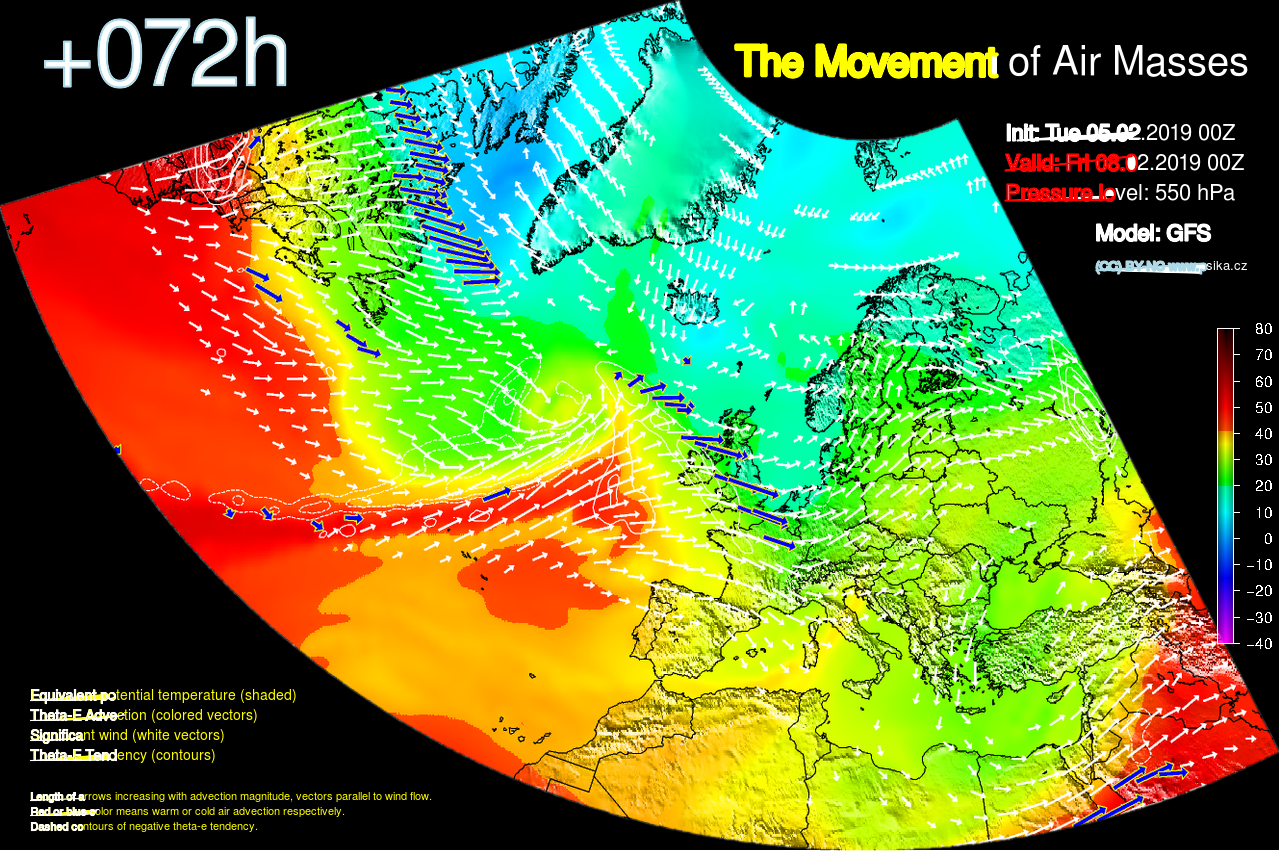
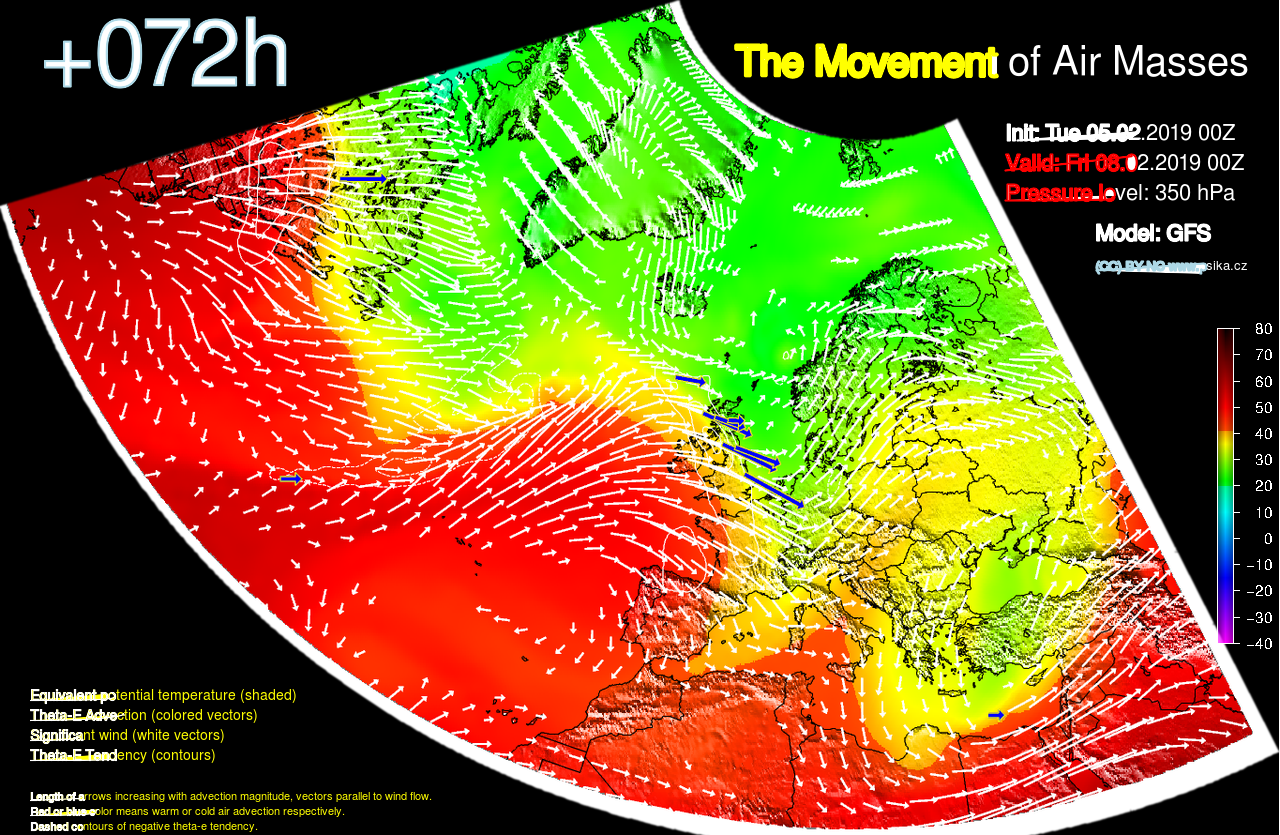
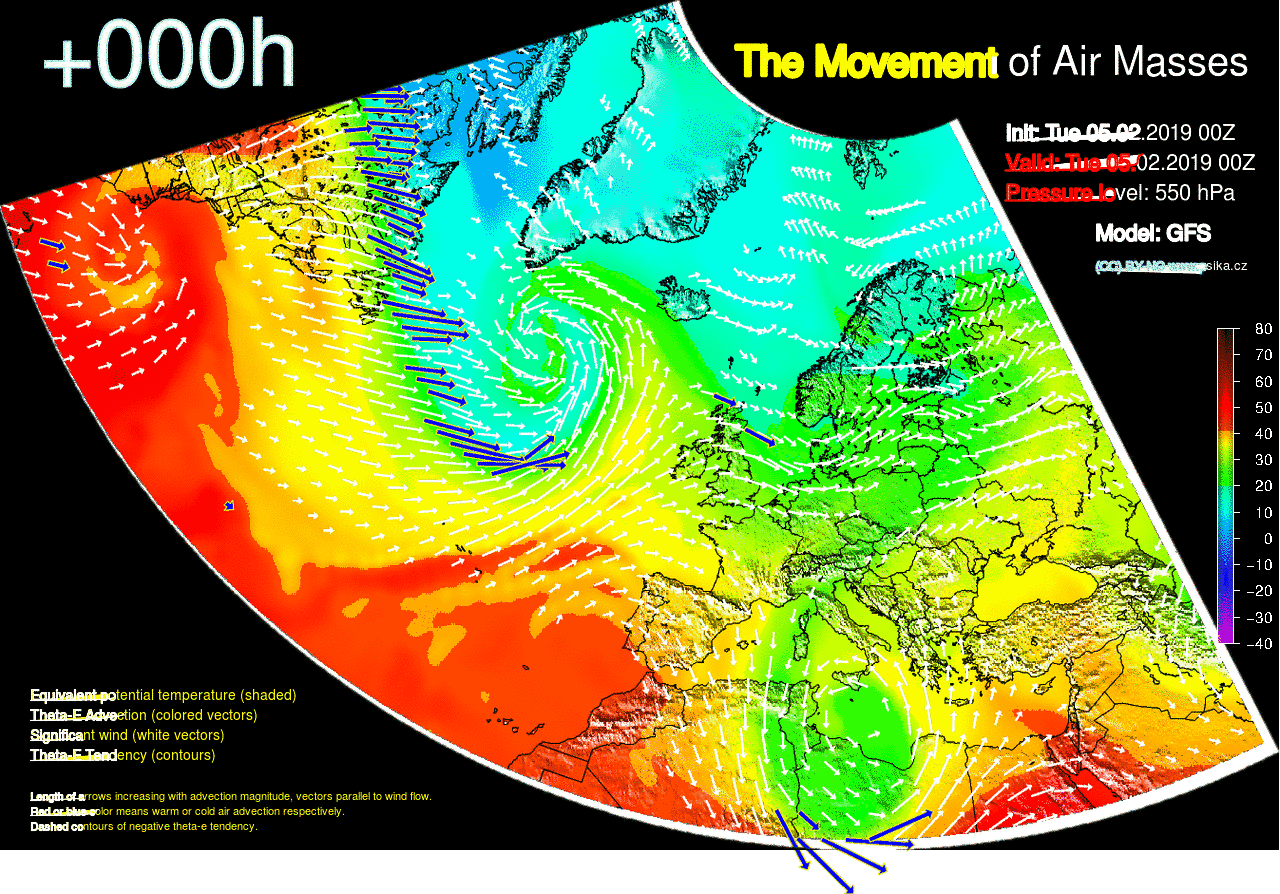
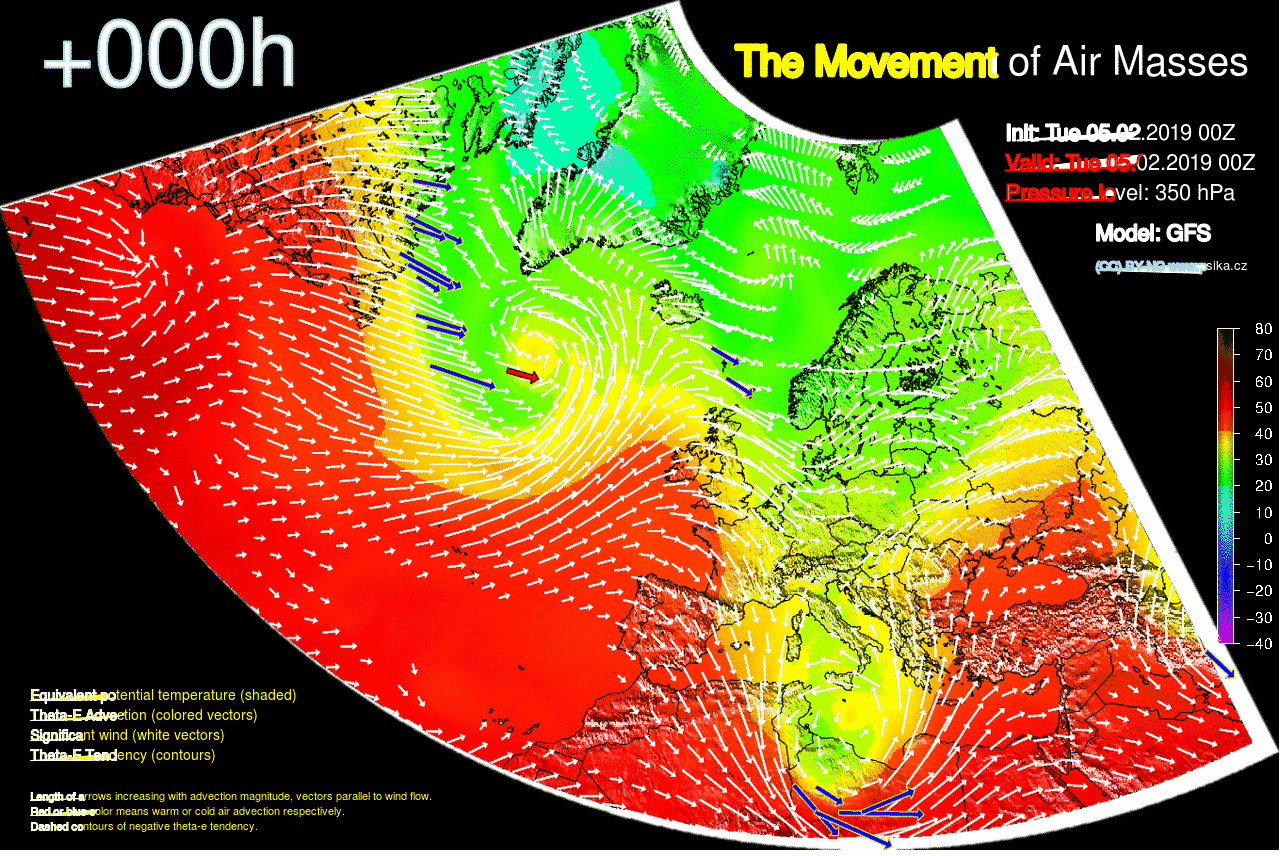
Prediction of air masses movement over Atlantic area. Most significant zones (fronts etc.) highlighted using colored vector fields.
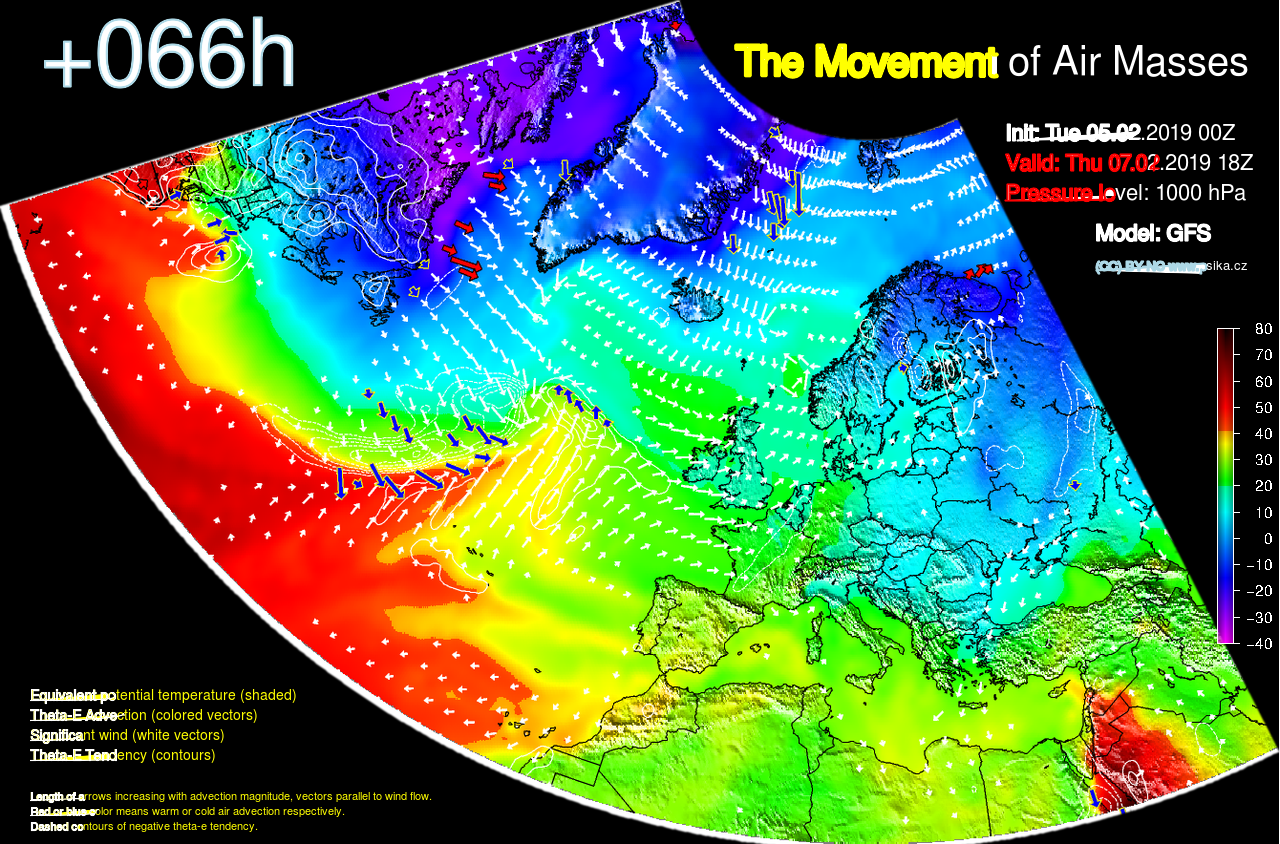
Prediction movement of air masses near surface in 3-day animation.
Map table
| Prediction time / Pressure layer | 1000 hPa | 700 hPa | 550 hPa | 350 hPa |
|---|---|---|---|---|
| 00h | X | X | X | X |
| +06h | X | X | X | X |
| +12h | X | X | X | X |
| +18h | X | X | X | X |
| + 24h | X | X | X | X |
| + 30h | X | X | X | X |
| + 36h | X | X | X | X |
| + 42h | X | X | X | X |
| + 48h | X | X | X | X |
| + 54h | X | X | X | X |
| + 60h | X | X | X | X |
| + 66h | X | X | X | X |
| + 72h | X | X | X | X |
| Animation | A | A | A | A |
Image properties:
- flat PNG images - 1280 x 850 px (1 - 1,5 MB)
- animation GIF images - 1280 x 850 px (~ 3,5 MB)
Features
- Multiple pressure layers (1000/700/550/350 hPa)
- Equivalent potential temperatures (shaded)
- Vectors of theta-e advection - vector magnitude equals to length of "advection" vector |gradHTe| . |w||, direction parallel to wind flow, red color for "warm" advection, blue for "cold" advection
- Contours of theta-e 6-hour tendency (dashed lines for negative tendency)
- Significant wind vectors (1000 hPa .. ws > 6 m/s, 700 - 350 hPa .. ws > 10 m/s)
- Animations
- 72-hour weather prediction
- Updated every 12/24 hours
Resources
- GFS model